Where have the triangles gone ?
Statsbomb started releasing open data a few years back for hobbyists (like me) to play around with and learn a few things (hopefully ?! ). A big chunk of that open data is dedicated to charting Lionel Messi’s journey with Barcelona’s first team for about 17 years. That journey finally came to an end come summer of ‘21….Messi cried, I cried, some people laughed….then we all shrugged and moved on with life. Statsbomb’s recent most release completed that data set, providing the data for the final season of Messi at Barcelona.
One of my goals (that I’ve been deferring for lack of time for a better part of a year) was to use this data and investigate - to some extent, whatever extent event data permits - some stylistic features of Barcelona’s gameplay that everyone (read : Pep and Xavi) keeps talking about. You know what I mean - triangles, triangles and triangles….Now, this is a project that has already been tackled (for a particular season) by a fantastic group of people. This paper by Prof. Dr. Javier M. Buldú et. al. deals exactly with this, and more. Along with another paper by Prof. Dr. Buldu et.al. , this serves as my starting point. In this post, I will briefly describe the recreation of some of the metrics presented in those two papers using the pass networks of Barcelona and their opposition.
First things first, you obviously need to download the Statsbomb open data. I pre-process it such that for each game, I have the pass network for Barcelona for the largest chunk of uninterrupted time. This could be from minute 0 till the first substitution, or the first red card (why, hello Lenglet !!). Or this could be from a very early first substitution till the second substitution. In short, whichever time interval is larger, I have used that for my pass network. Now, when I say network, I really am referring to just the pass matrix that shows all passes going from player A to player B for all possible pairs (A,B) within the team. I also repeat this for the opposition, as I want to keep track of how the opposition faired stylistically in comparison to Barcelona.
Graphs
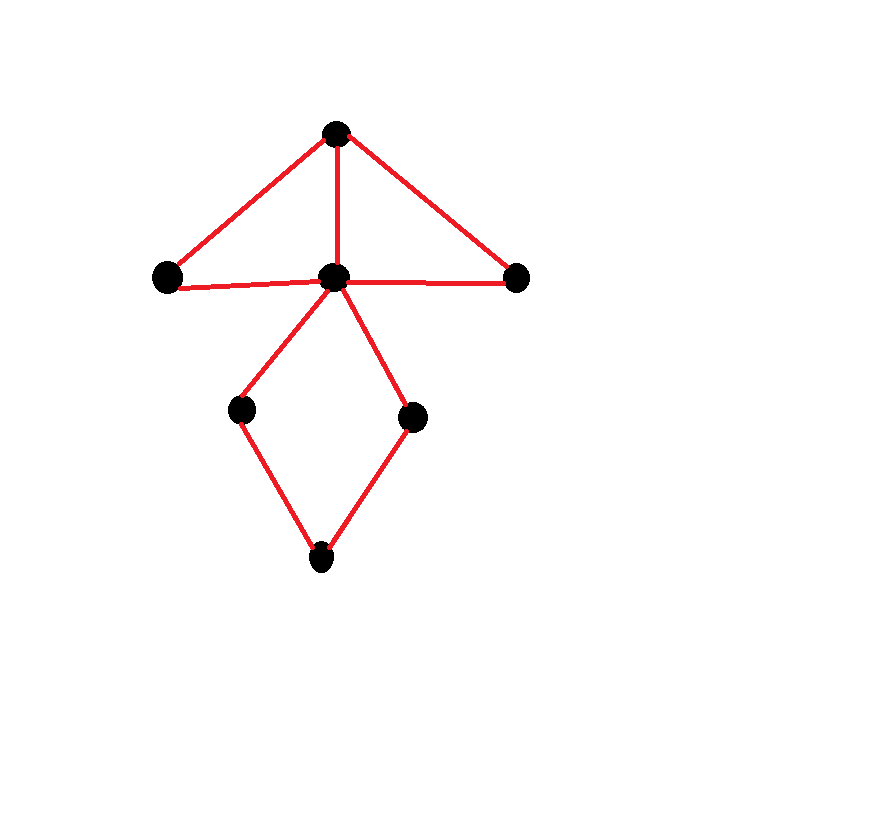
The very first metric is the one that’s often colloquially referred to by all and sundry - triangles. How do we measure that ? Or what do we even mean by triangles ? Fortunately for us, graphs/network science can help answer that question. In fact, aspects of network science will be used to construct and present all the metrics in this post. So let’s take a quick detour into the world of graphs. I won’t go into excruciating mathematical details. For interested readers, I have already linked the two papers I’ve used as references above. There are also fantastic books on this subject - Albert-Laszlo Barabasi and Mark Newman come to mind. Read up those for the full details. In short, graphs are collections of nodes and edges. Nodes, or vertices, are just points - could be real coordinate points or some abstraction (players in football) and the edges are the lines that connect these points - could be real paths between points, or some abstraction (like passing links in football). A sample graph is shown below :

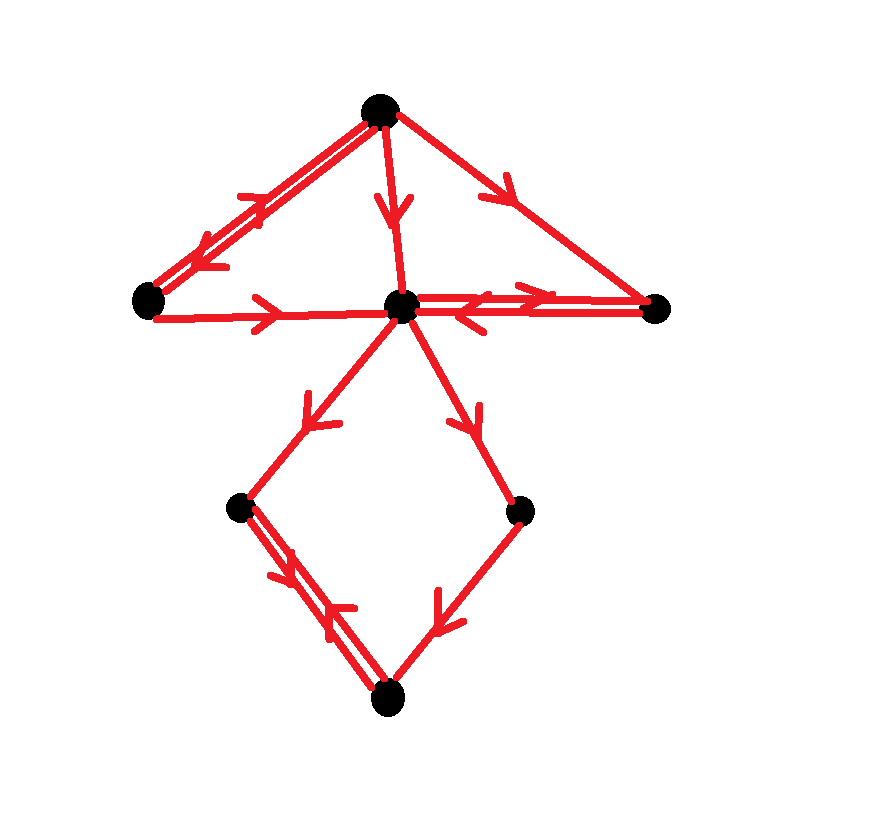
The graph above is called “undirected” because the edges don’t show any directionality - they only represent the total connection between two nodes. The graph below is “directed” because the edges show directionality :

In football pass networks lingo, think of undirected graphs as representing total pass exchange between players, while directed graphs distinguish between passes from A to B and passes from B to A.
Triangles
Now, you can see in the above graphs how certain triangles are forming around certain nodes. However, its not necessary for any three sets of nodes to form triangles as is visible. (In football lingo, imagine this - Messi passes to Alba, Alba passes to Fati, but Fati doesn’t make a successful pass to Messi during the game). Such three sets of nodes will form triads and only certain triads will have closure to form triangles. Then, the propensity to form triangles is the first metric we wish to capture. But, as the papers do, we don’t just try to capture triangle completions but also try to see if the triangles are balanced, i.e., similar volume of passes exchanged among three players to and fro. So, we use the weighted and directed pass network - weight being equal to the number of passes from player A to B for all combinations of A and B - and try to measure a notion of “balanced” triangles. The python library used is called networkx, and the metric is called “clustering coefficient”, with the pass numbers passed as weights. This produces the following for all seasons and managers. Larger numbers imply higher tendency to form balanced triangles.

Player interconnectivity
The next metric tries to examine how well path-connected the players are within the team. This is done by calculating the shortest paths that exist between two players. If there is no direct path, this will typically go through some subset of other players. For eg. there could be direct connection between Messi and Alba in one game, and then via Busquets and Iniesta in another one. Once again, we are using weighted paths here - weight being equal to the pass numbers. If there are higher number of passes exchanged, then the weight of the path is high and the two nodes are “close” to each other. So, “closeness” is inversely proportional to the number of passes exchanged. So, first create a matrix where all non-zero elements are inverted, and then use Dijkstra’s algorithm to evaluate “closeness”/”interconnectivity”. Here, smaller numbers mean players are more connected within the team. The seasonal/managerial variations are shown below :

Network strength and robustness
The next metric tries to capture network strength - greater number of links between nodes and important nodes connected with each other. Importance here is being measured as eigenvector centrality, and the network strength is the largest eigenvalue of the weighted pass network/adjacency matrix. Larger values imply greater network strength.

Dissociation into sub-parts
Finally, we look at another notion of interconnectivity. This metric tries to measure how vulnerable is the network to falling apart into smaller disconnected subparts. Larger numbers imply more interconnectivity and less vulnerable to breaking apart. The measure used here is the second smallest eigenvalue of the Laplacian matrix, which can be formed by subtracting off the weighted adjacency matrix from a diagonal matrix whose elements represent the total number of passes made by each player of the team

Well…this brings an end to the post. Please read the original papers - they go into much more depth about everything than I do. And let me know if you have any questions.