Possession Chains - To survive or not to survive, that is the question.
Let me, as is the norm in my blog posts, start by pointing out the inspirations for writing this post. I was having discussions with Paul Johnson about how we could apply survival analysis in football, and he came up with this really cool idea of using survival analysis to investigate possession chains. Also, lots of Barcelona fans (myself included) are voicing dissatisfactions with how the team lacks composure and goes for unnecessary verticality especially in key Champions League games when things are not going their way - this is well documented in Domagoj Kostanjsak’s article here. I finally had the impetus to do some quick checks and finally enter the rabbit hole of survival analysis properly. If you don’t care about the rest of the article, this is how Barcelona has been faring over the years in terms of retaining possession for long durations in Champions League matches (since 2008-09).
A Brief Intro to Survival Analysis and Methodology
What is survival analysis, you may ask ? In clinical studies, it could be the study of literal survival - that is, time until death from some disease. It could be the study of reoccurence of a disease if it has occured once in the past - eg being cancer. It could have nothing to do with diseases at all - for eg, could be the study of premature births. The end event is often referred to as the “death event”.
In the context of football, and in particular for us, we use survival analysis techniques to study the duration of possession chains for Barcelona’s UCL campaigns starting from Pep Guardiola’s reign. “Possession Chains” are defined sort of loosely - we follow the “touch-based actions” definition of Opta, and a series of touches by the same team constitutes a possession chain. If it’s interrupted even for once by an opposition touch-based action, the possession chain comes to an end and a new one starts. So this is different from “possession sequences” where we wait for the opposition to establish control of possession by say, possessing the ball for 6 seconds or more, or possessing the ball for 3 or more controlled touch-based actions etc. We do omit “pinball chains” - basically single action long chains - eg. two players belonging to opposite teams playing head tennis with the football a la the Championship.
We have naturally “censored” data in football. In a clinical study context, this would mean a patient fails to follow up or opt out of an study before the designated end-period of the study arrives, or doesn’t encounter “death” (“death” being a mnemonic for actual death, occurence/reoccurence of a disease, occurence/reoccurence of pregnancy etc). Here are some possible censorings that can happen in football :
(i) In the study of possession chains, it can so happen that the first half or the second half of the match comes to an end while one of the team is in possession of the ball - that possession chain didn’t encounter the “death event” before the match (the study period) ended.
(ii) The natural objective of possession chains is being able to take a shot at the opposition goal, so any chain that ends with a shot and is not a “pinball chain” also is assumed to have not encountered the “death event”, instead it’s a “censored chain”.
(iii) Now, one can argue that shots are not always possible and the objective of the team should be able to reach as dangerous a zone as possible or achieve the next best thing to a direct shot. These could be - (a) winning a penalty, (b) winning a corner kick or (c) winning a free-kick high up the pitch. Any sequence that ends with a penalty, we will definitely call them “censored”.
(iv) Corner kicks are won in different ways. For eg a shot that gets palmed away by the keeper or blocked by a defender and goes out for a corner. However, the shot itself defines the “censoring” so we don’t have to overthink about this case. Another eg could be a dangerous cross that’s headed out for a corner. Or, a winger works his way to the corner flag, tightly marked by one or many opposition, realises he can’t wiggle out of the situation and then kicks the ball against the opposition to win a corner. We will define this particular case as a “censored chain” since this was the next best possible outcome for that chain and is done intentionally. The cross that reached the box before being headed away….well, it’s subjective to figure out whether to call it a “censored chain” or not - certainly not possible to deduce only from data, so we are going to define those events as “death events”. Any corner kick won within a 10 m radius of the corner flags will be flagged “intentional” and hence “censored”.
(v) There is a ton of subjectivity involved with freekicks. Players like Jack Grealish make their bread and butter with winning freekicks high up, but not all players win freekicks intentionally. So, we will skip the subjectivity and call all possession chains ending with a freekick to have met their “death” - no censoring here.
(vi) All other types of chain ends - tackles, interceptions, clearances etc - bring “death” to the chain, no censoring here.
Now, we will be plotting “survival curves” to show the chance of a possession chain surviving beyeon time t (in seconds). Typical possession chains are very short - less than 10 seconds. The longest chains probably last for a minute or two, maybe a bit more. How do survival curves typically look like ? Well, at the beginning, since nothing has happened, chance of surviving beyond that point is 100%, so survival curves start from 1 and then slowly goes down to zero as time progresses and events keep happening. We don’t know apriori what form these curves will take, so we plot a non-parametric form known as the Kaplan-Meier Survival Curve. We can also study the partial effects of various factors on the survival curve via a regression technique called Cox Proportional Hazards Model. Both of these have been implemented via the fantastic lifelines package by Cam Davidson-Pilon.
A Journey through the pages of History
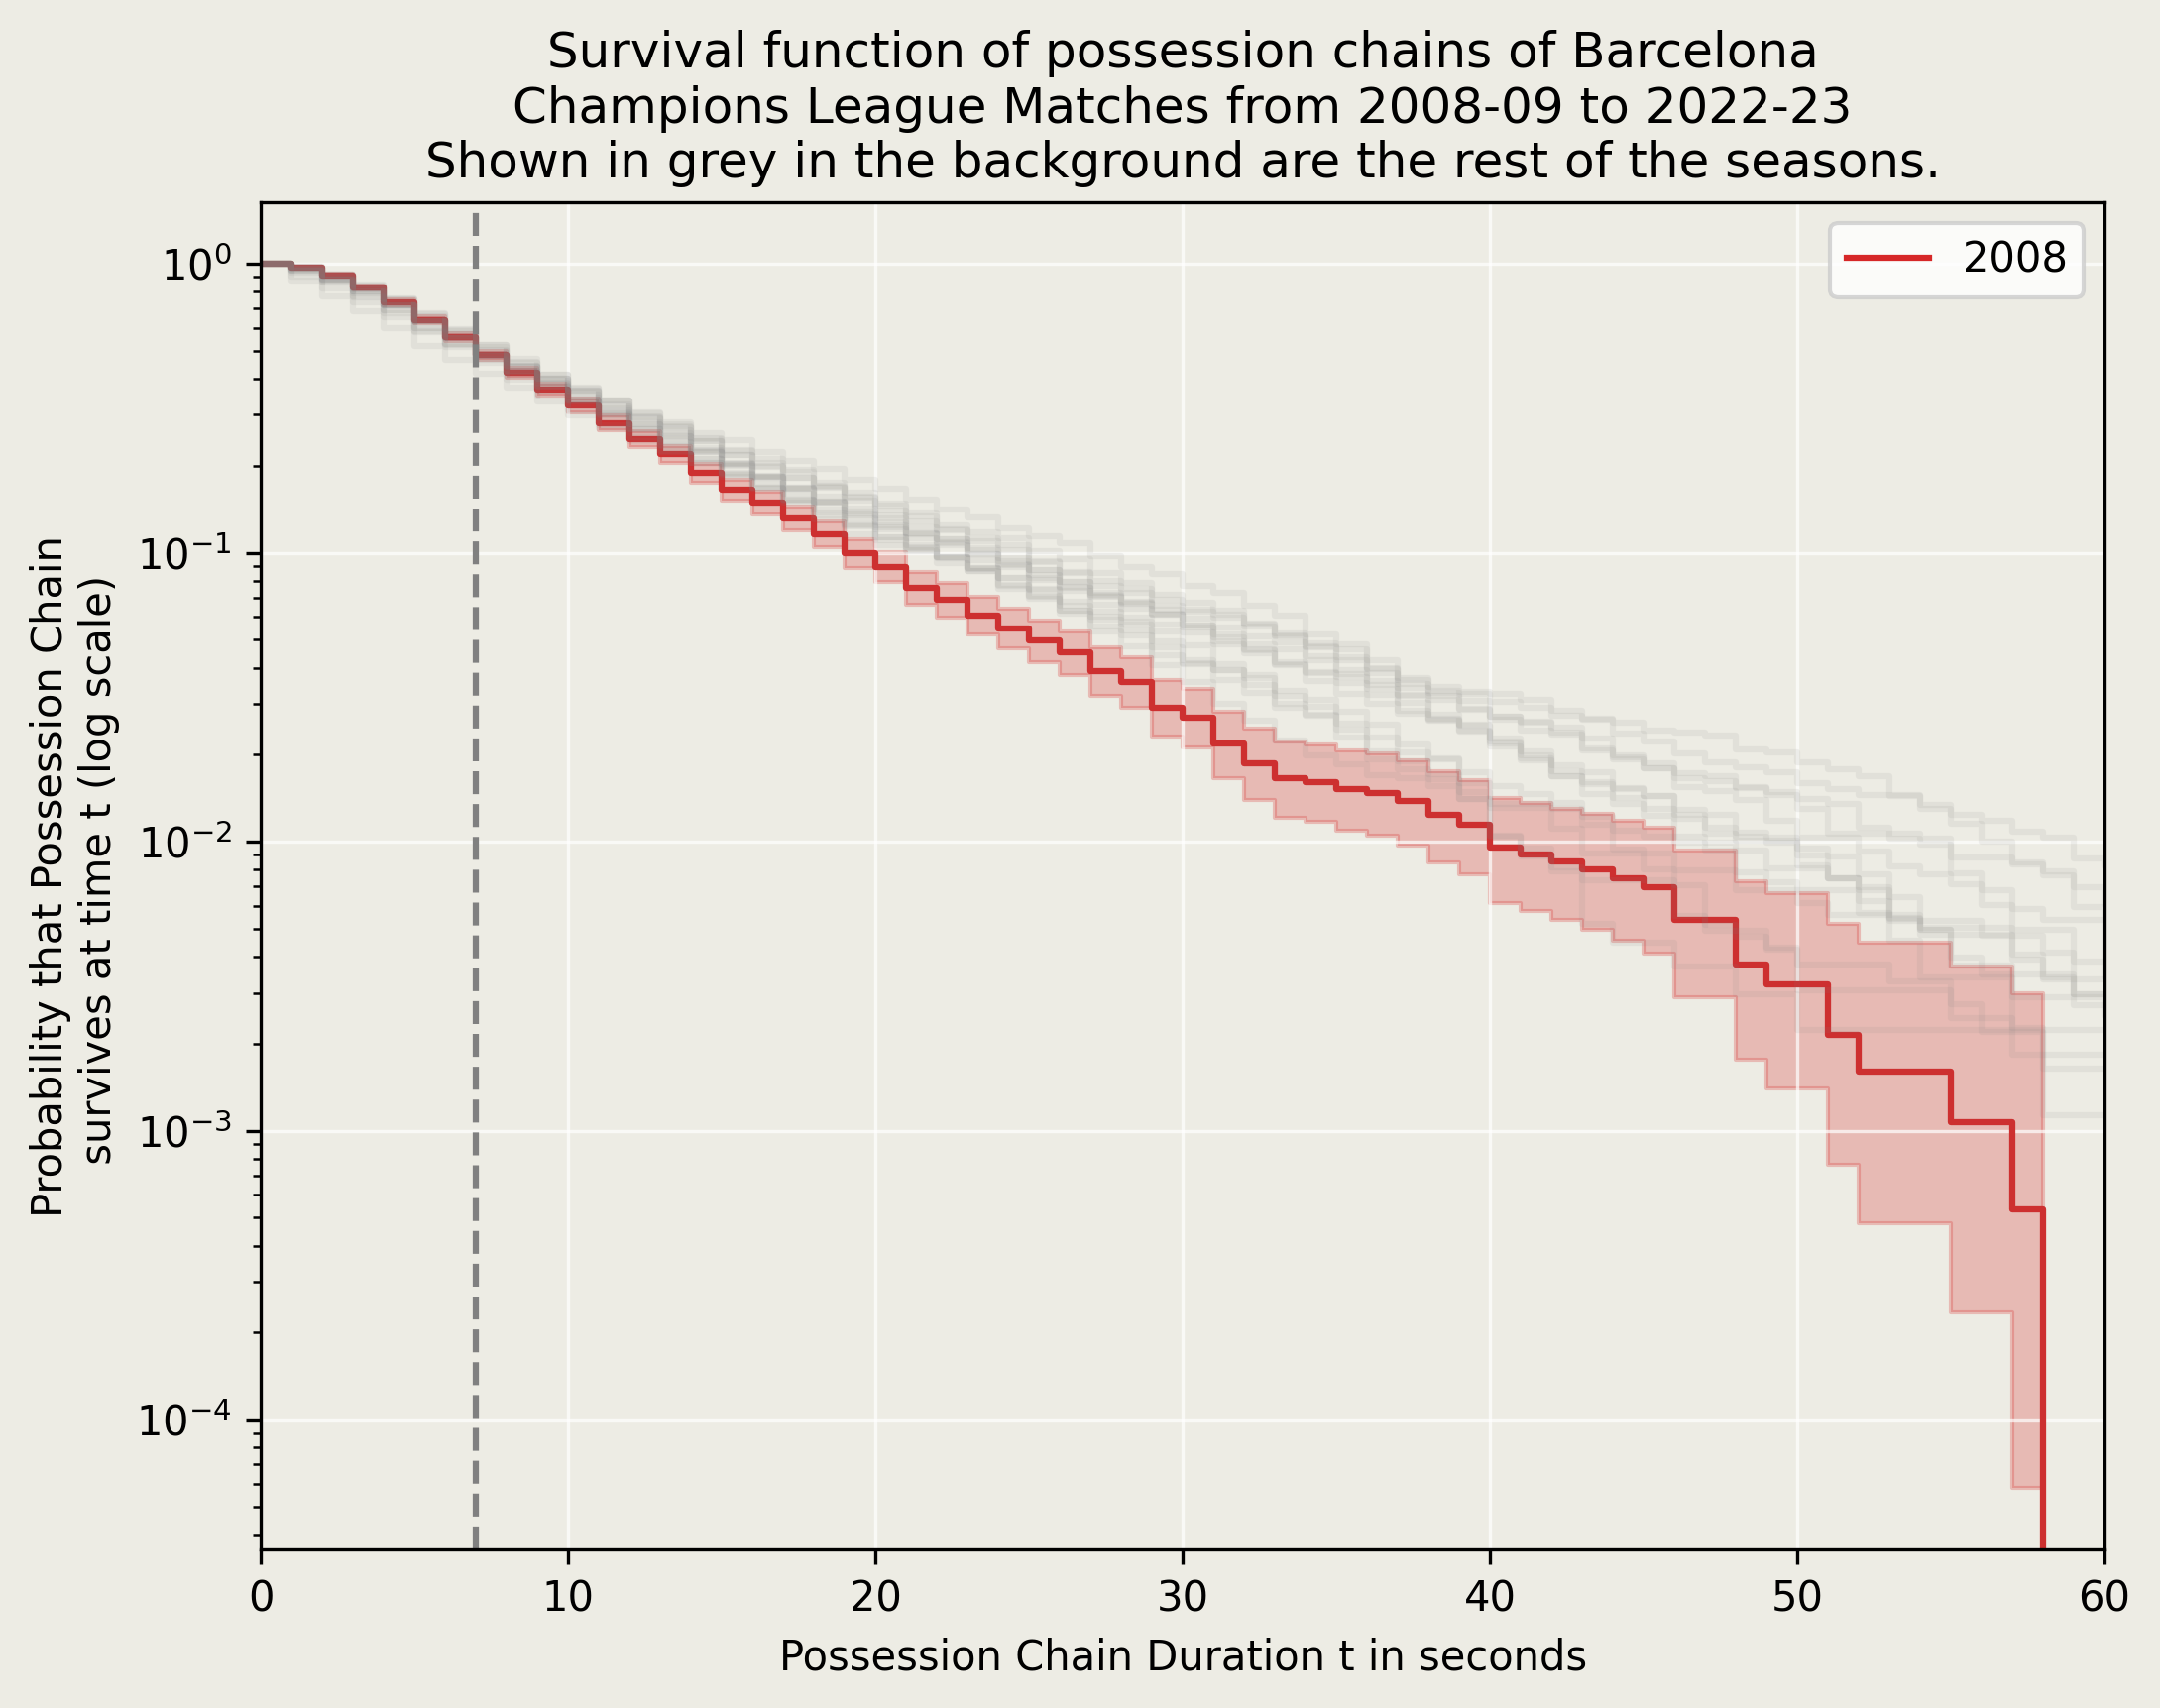
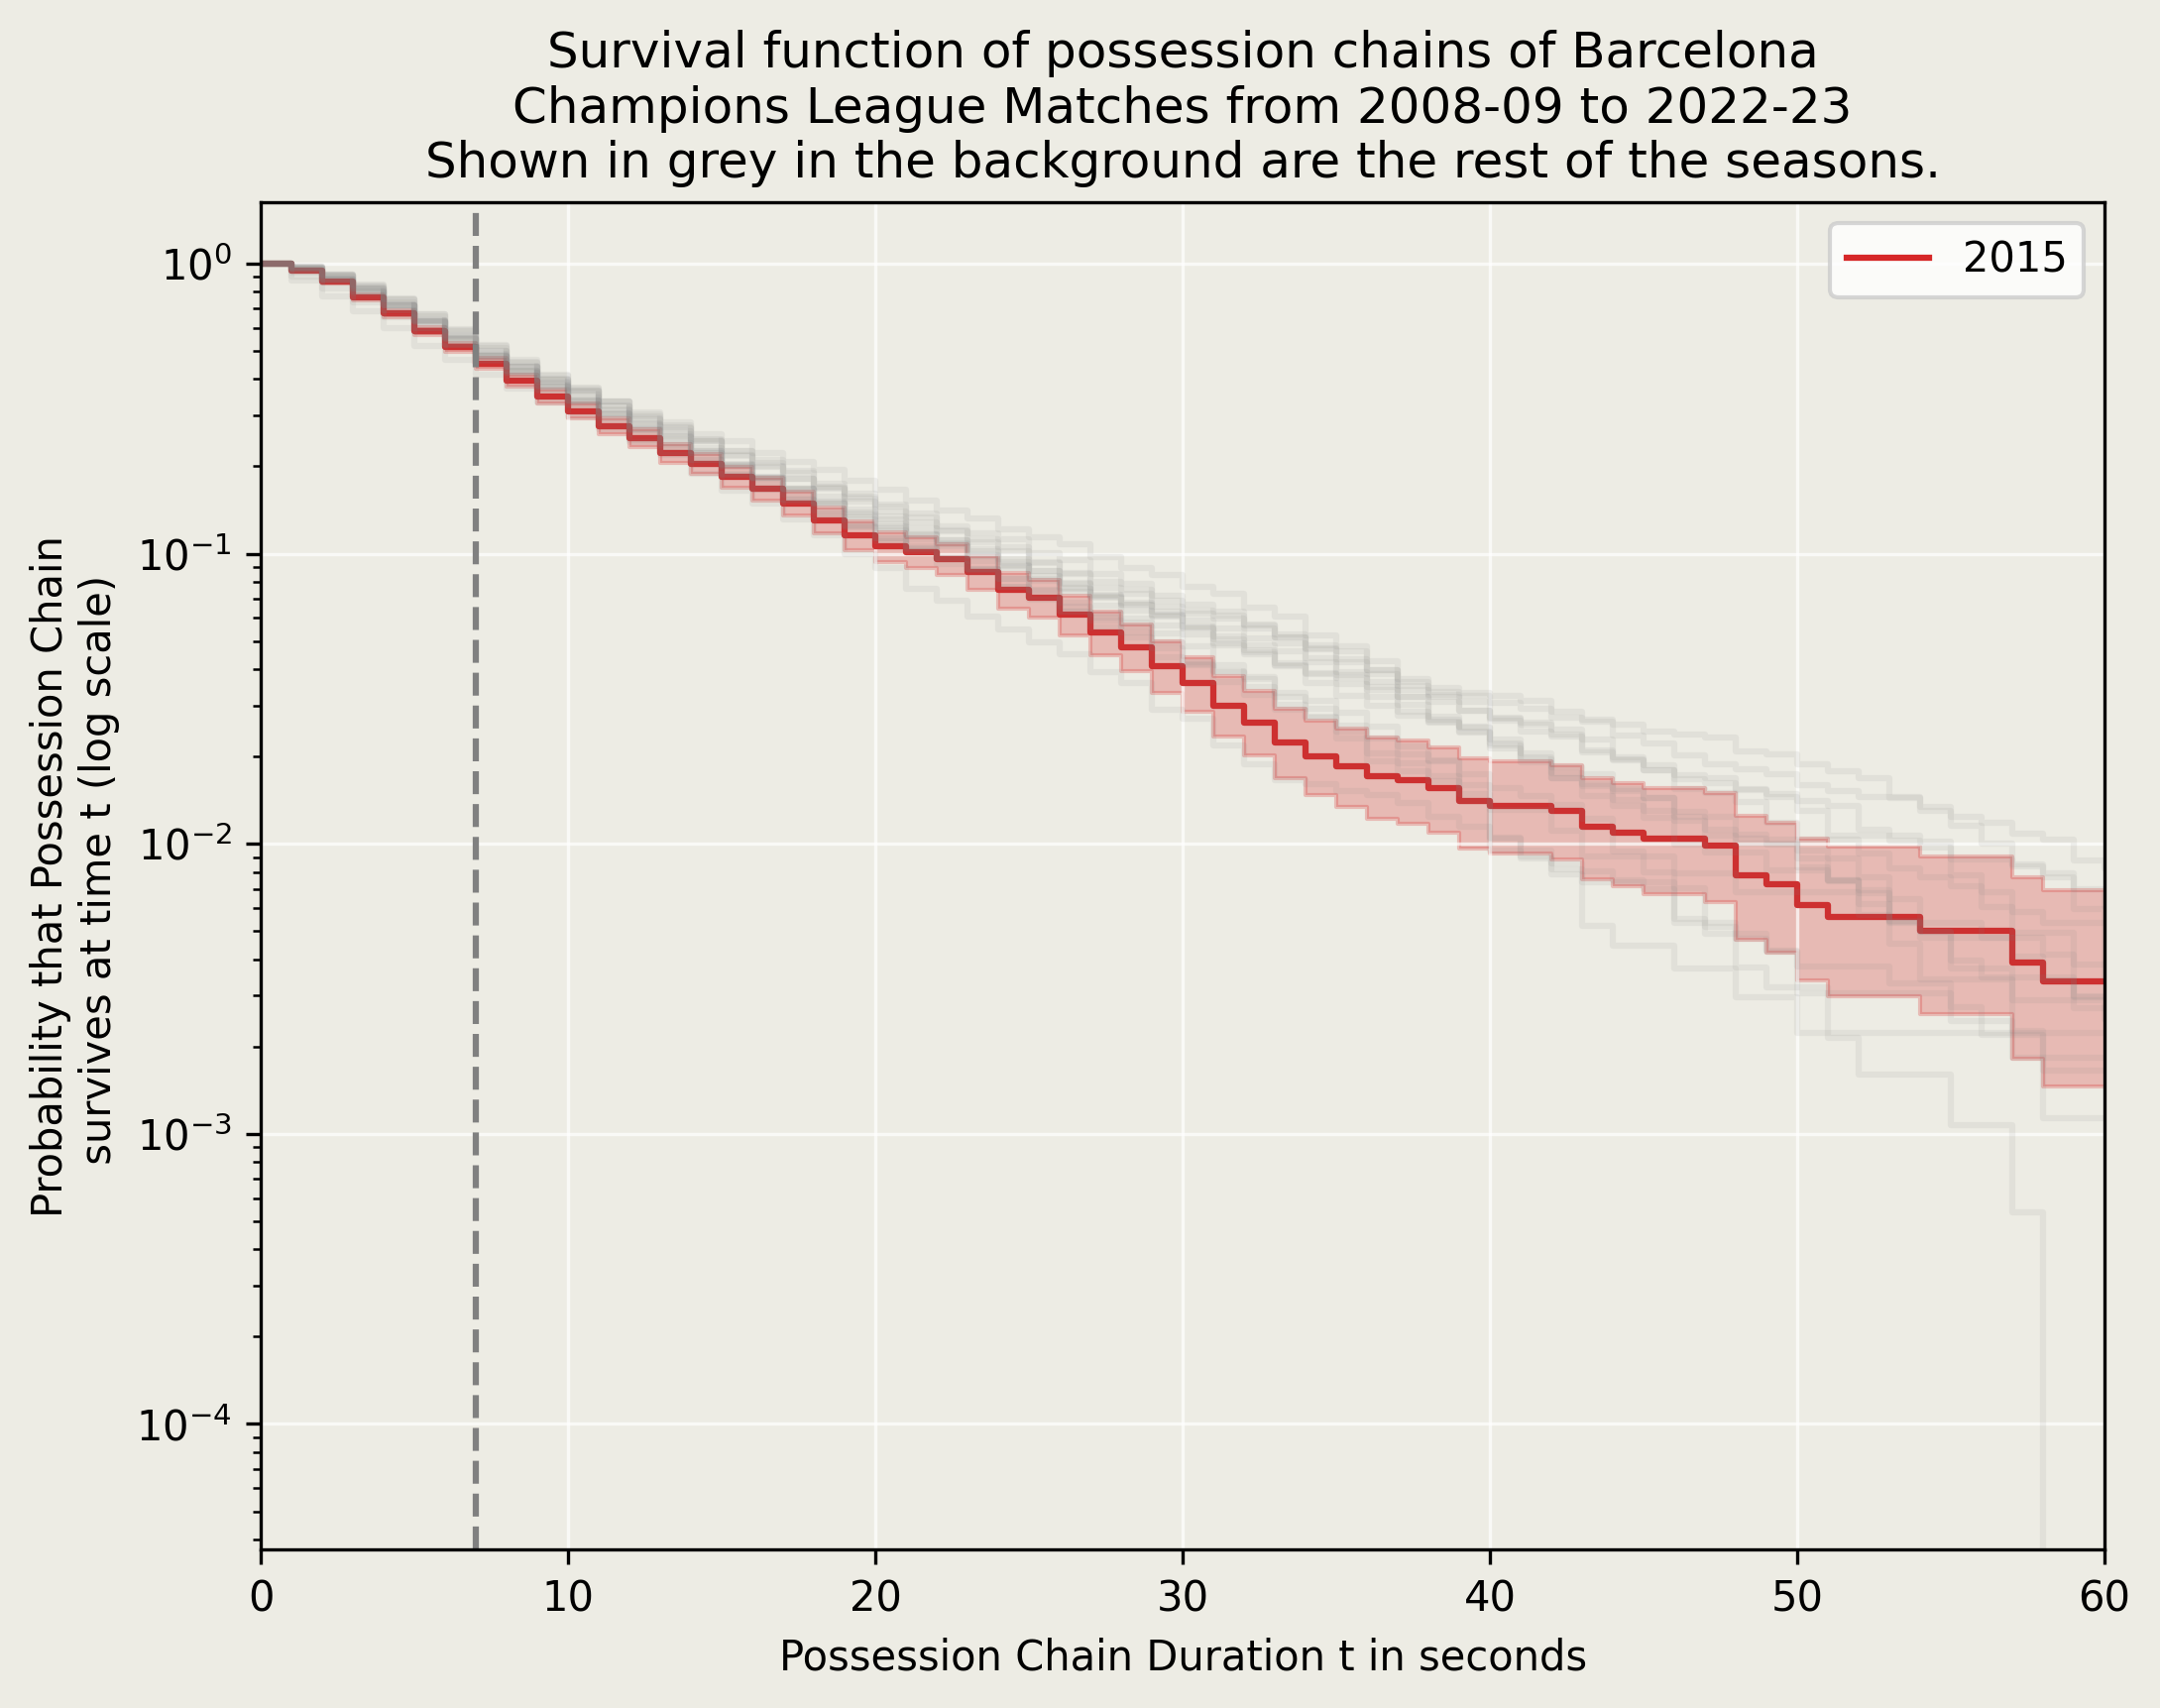
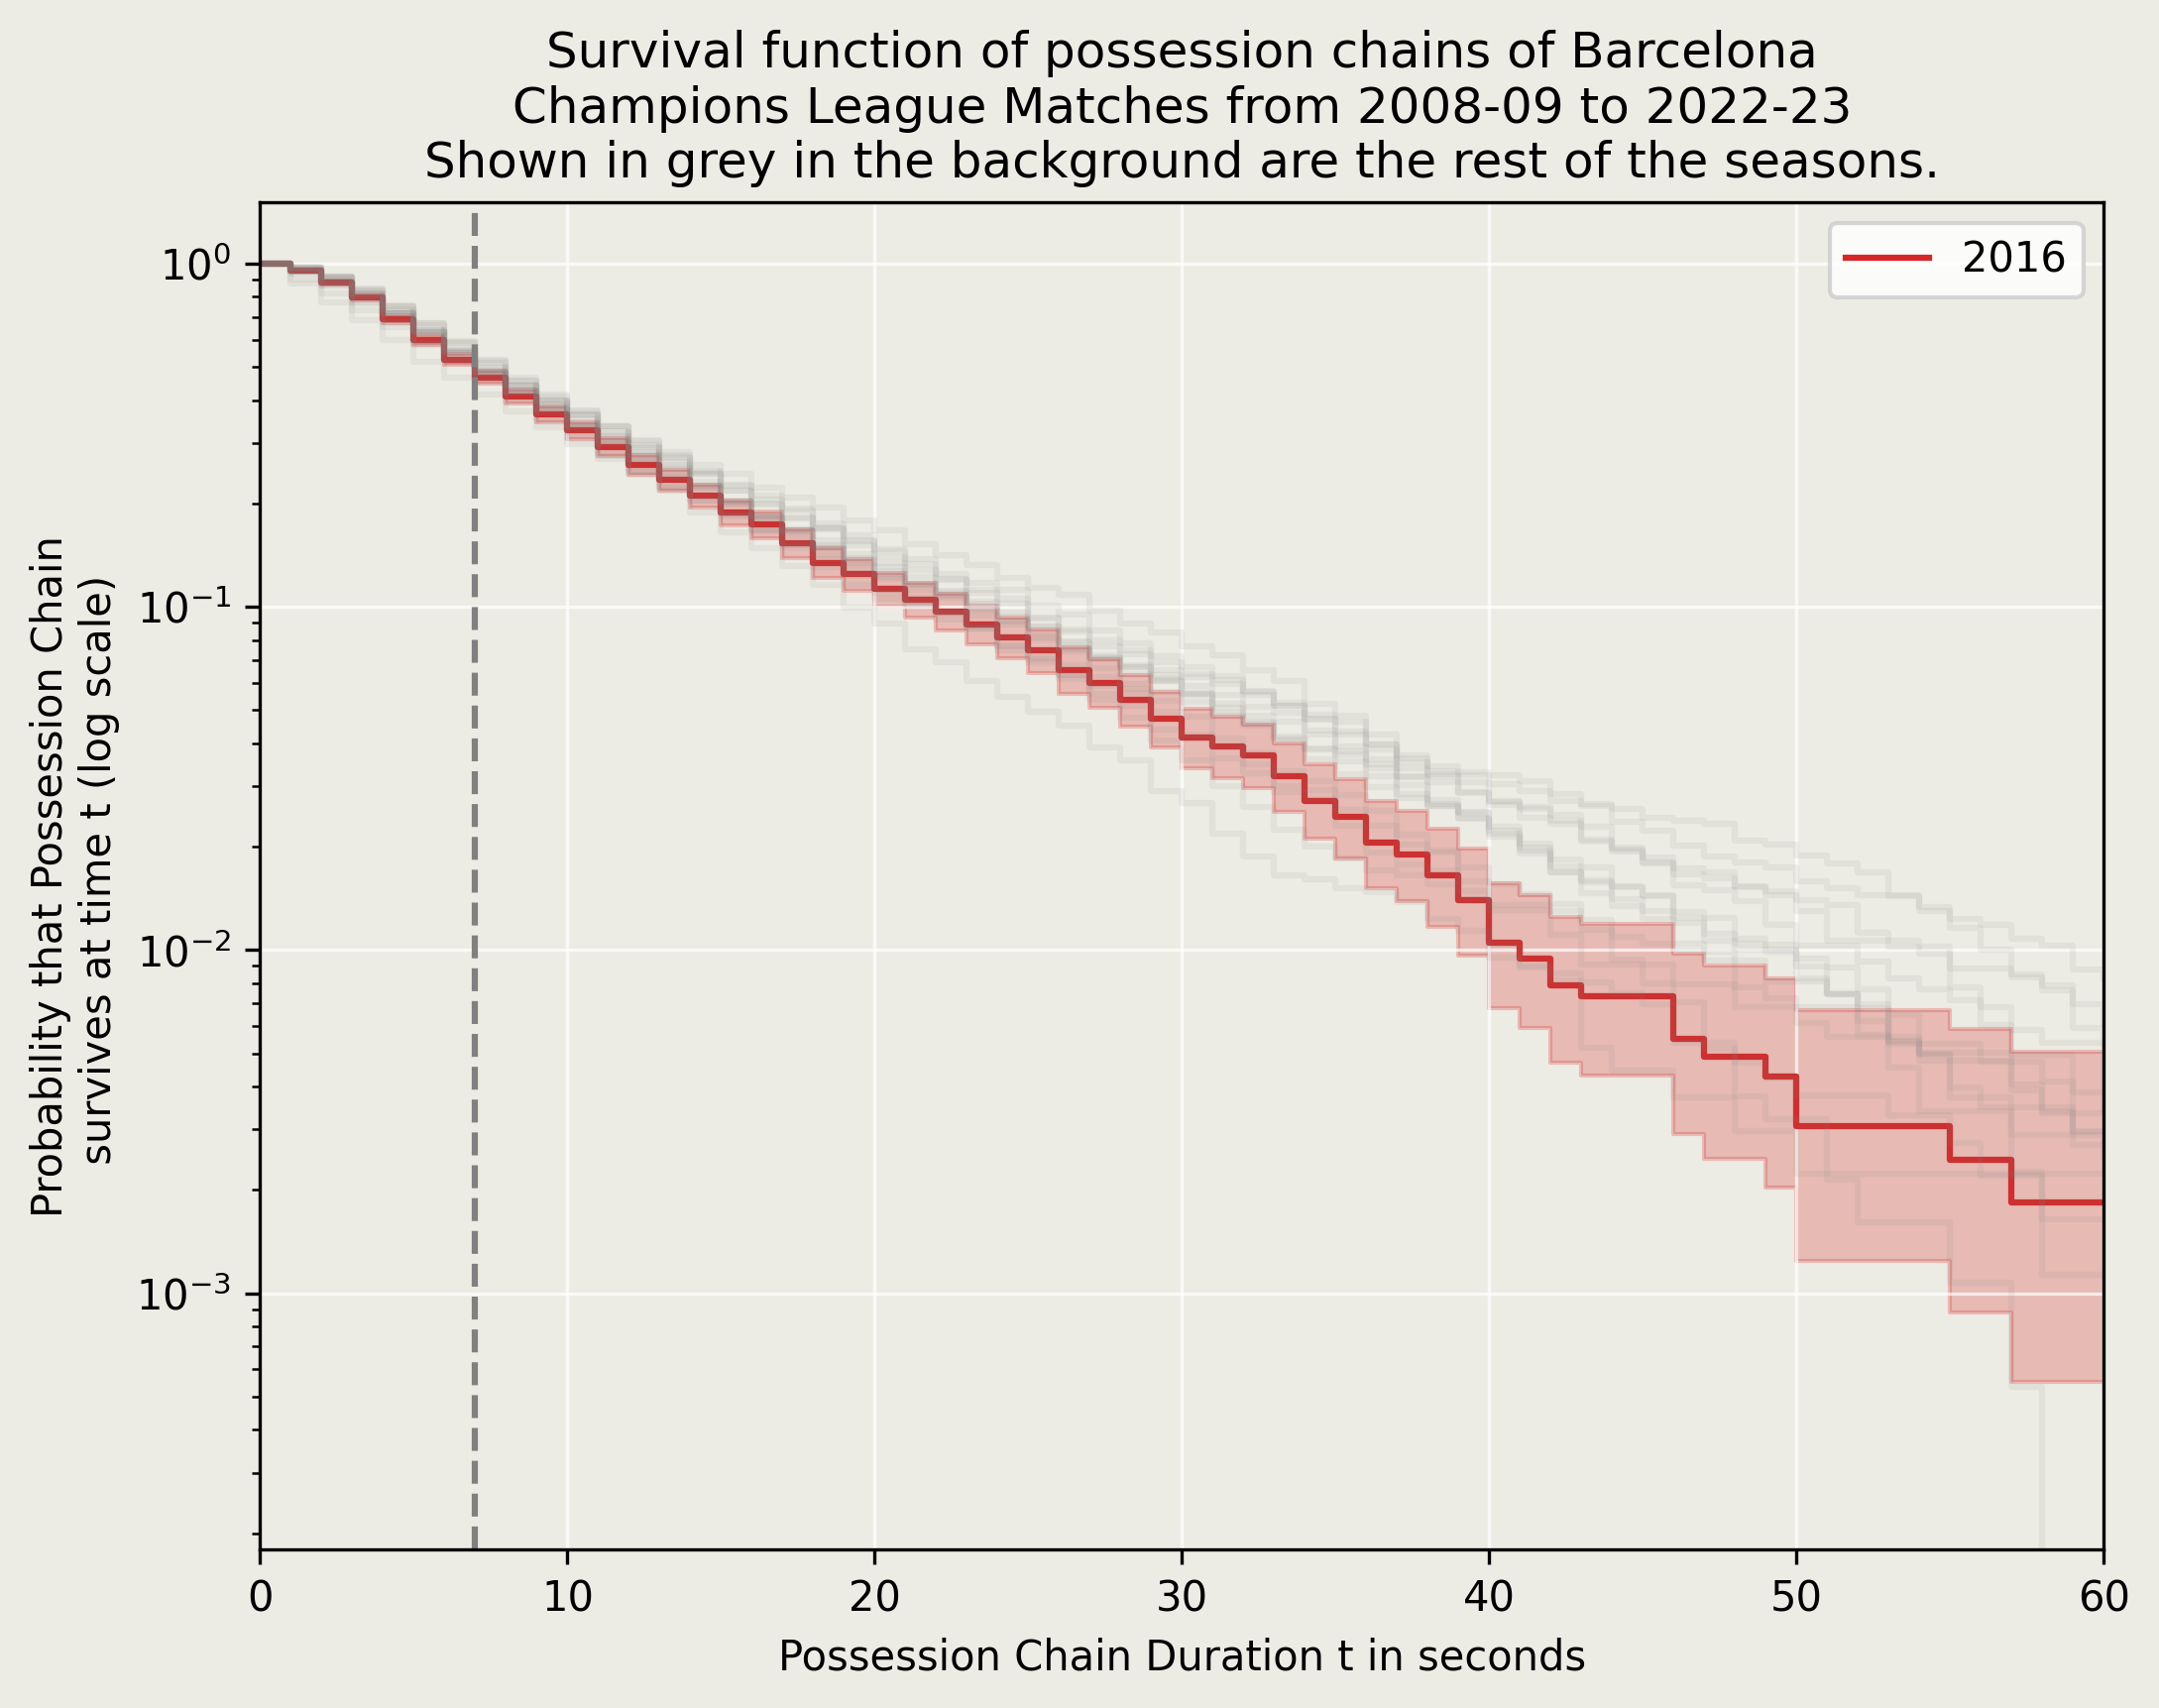
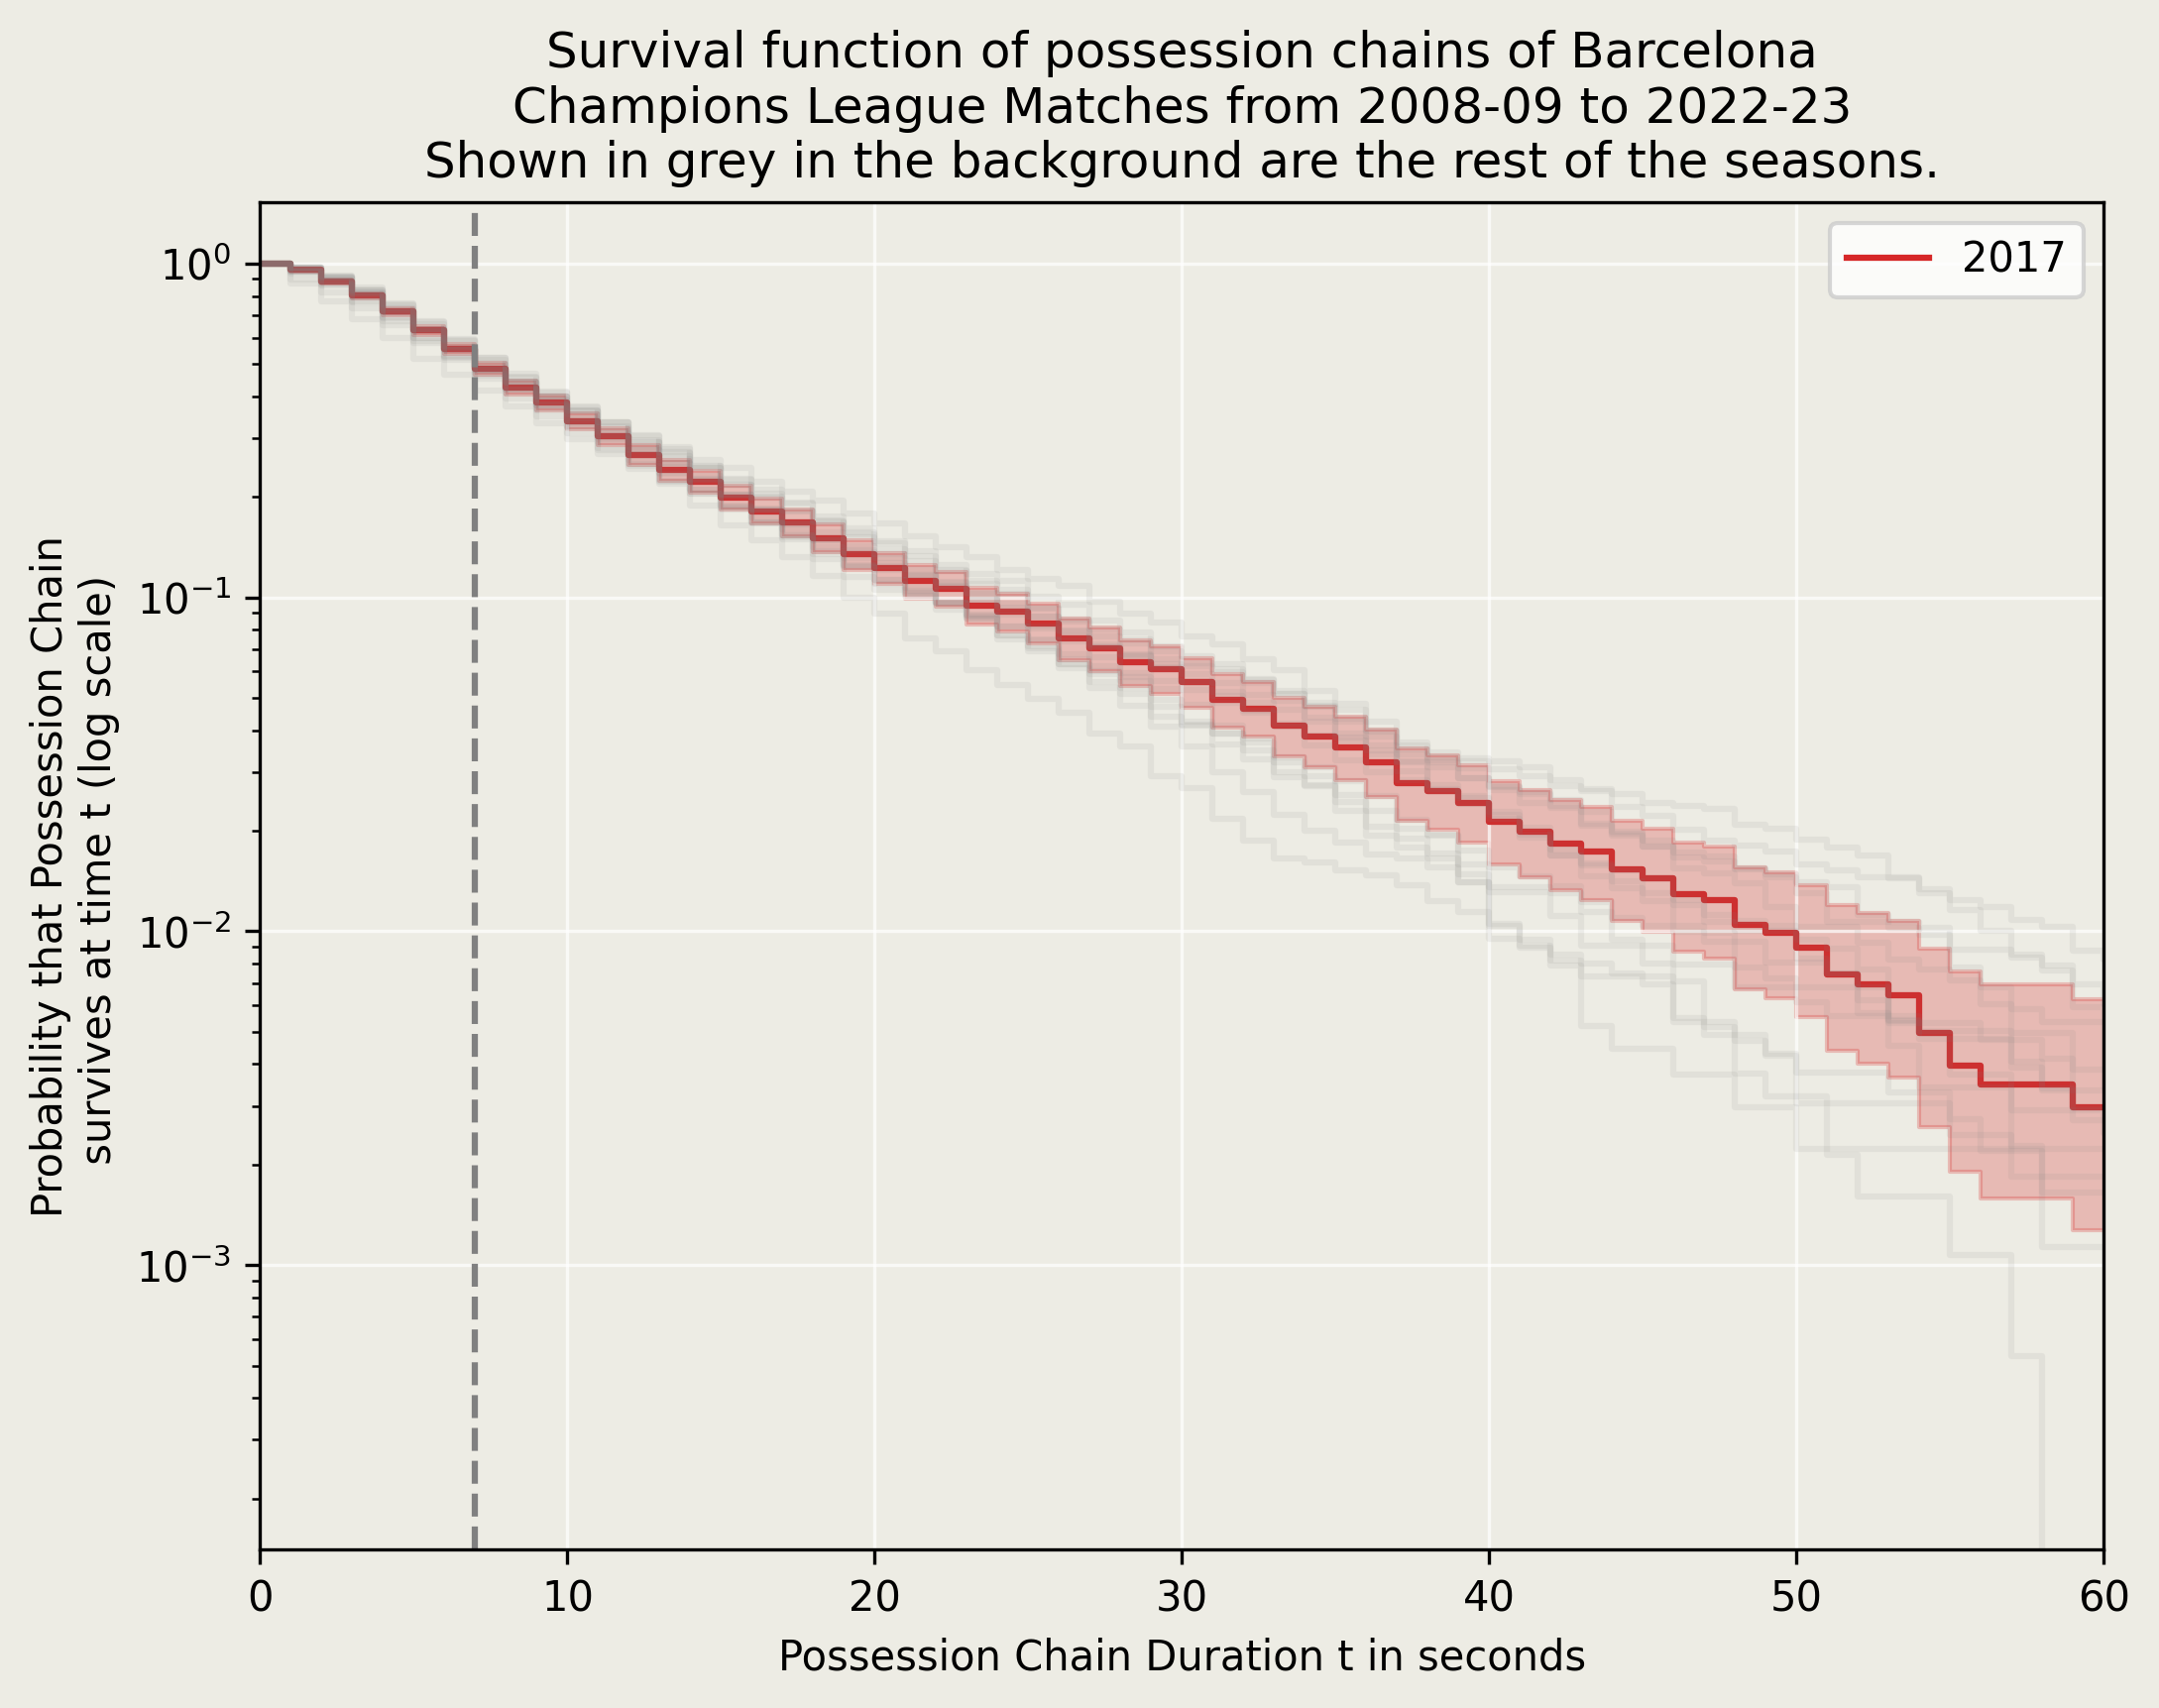
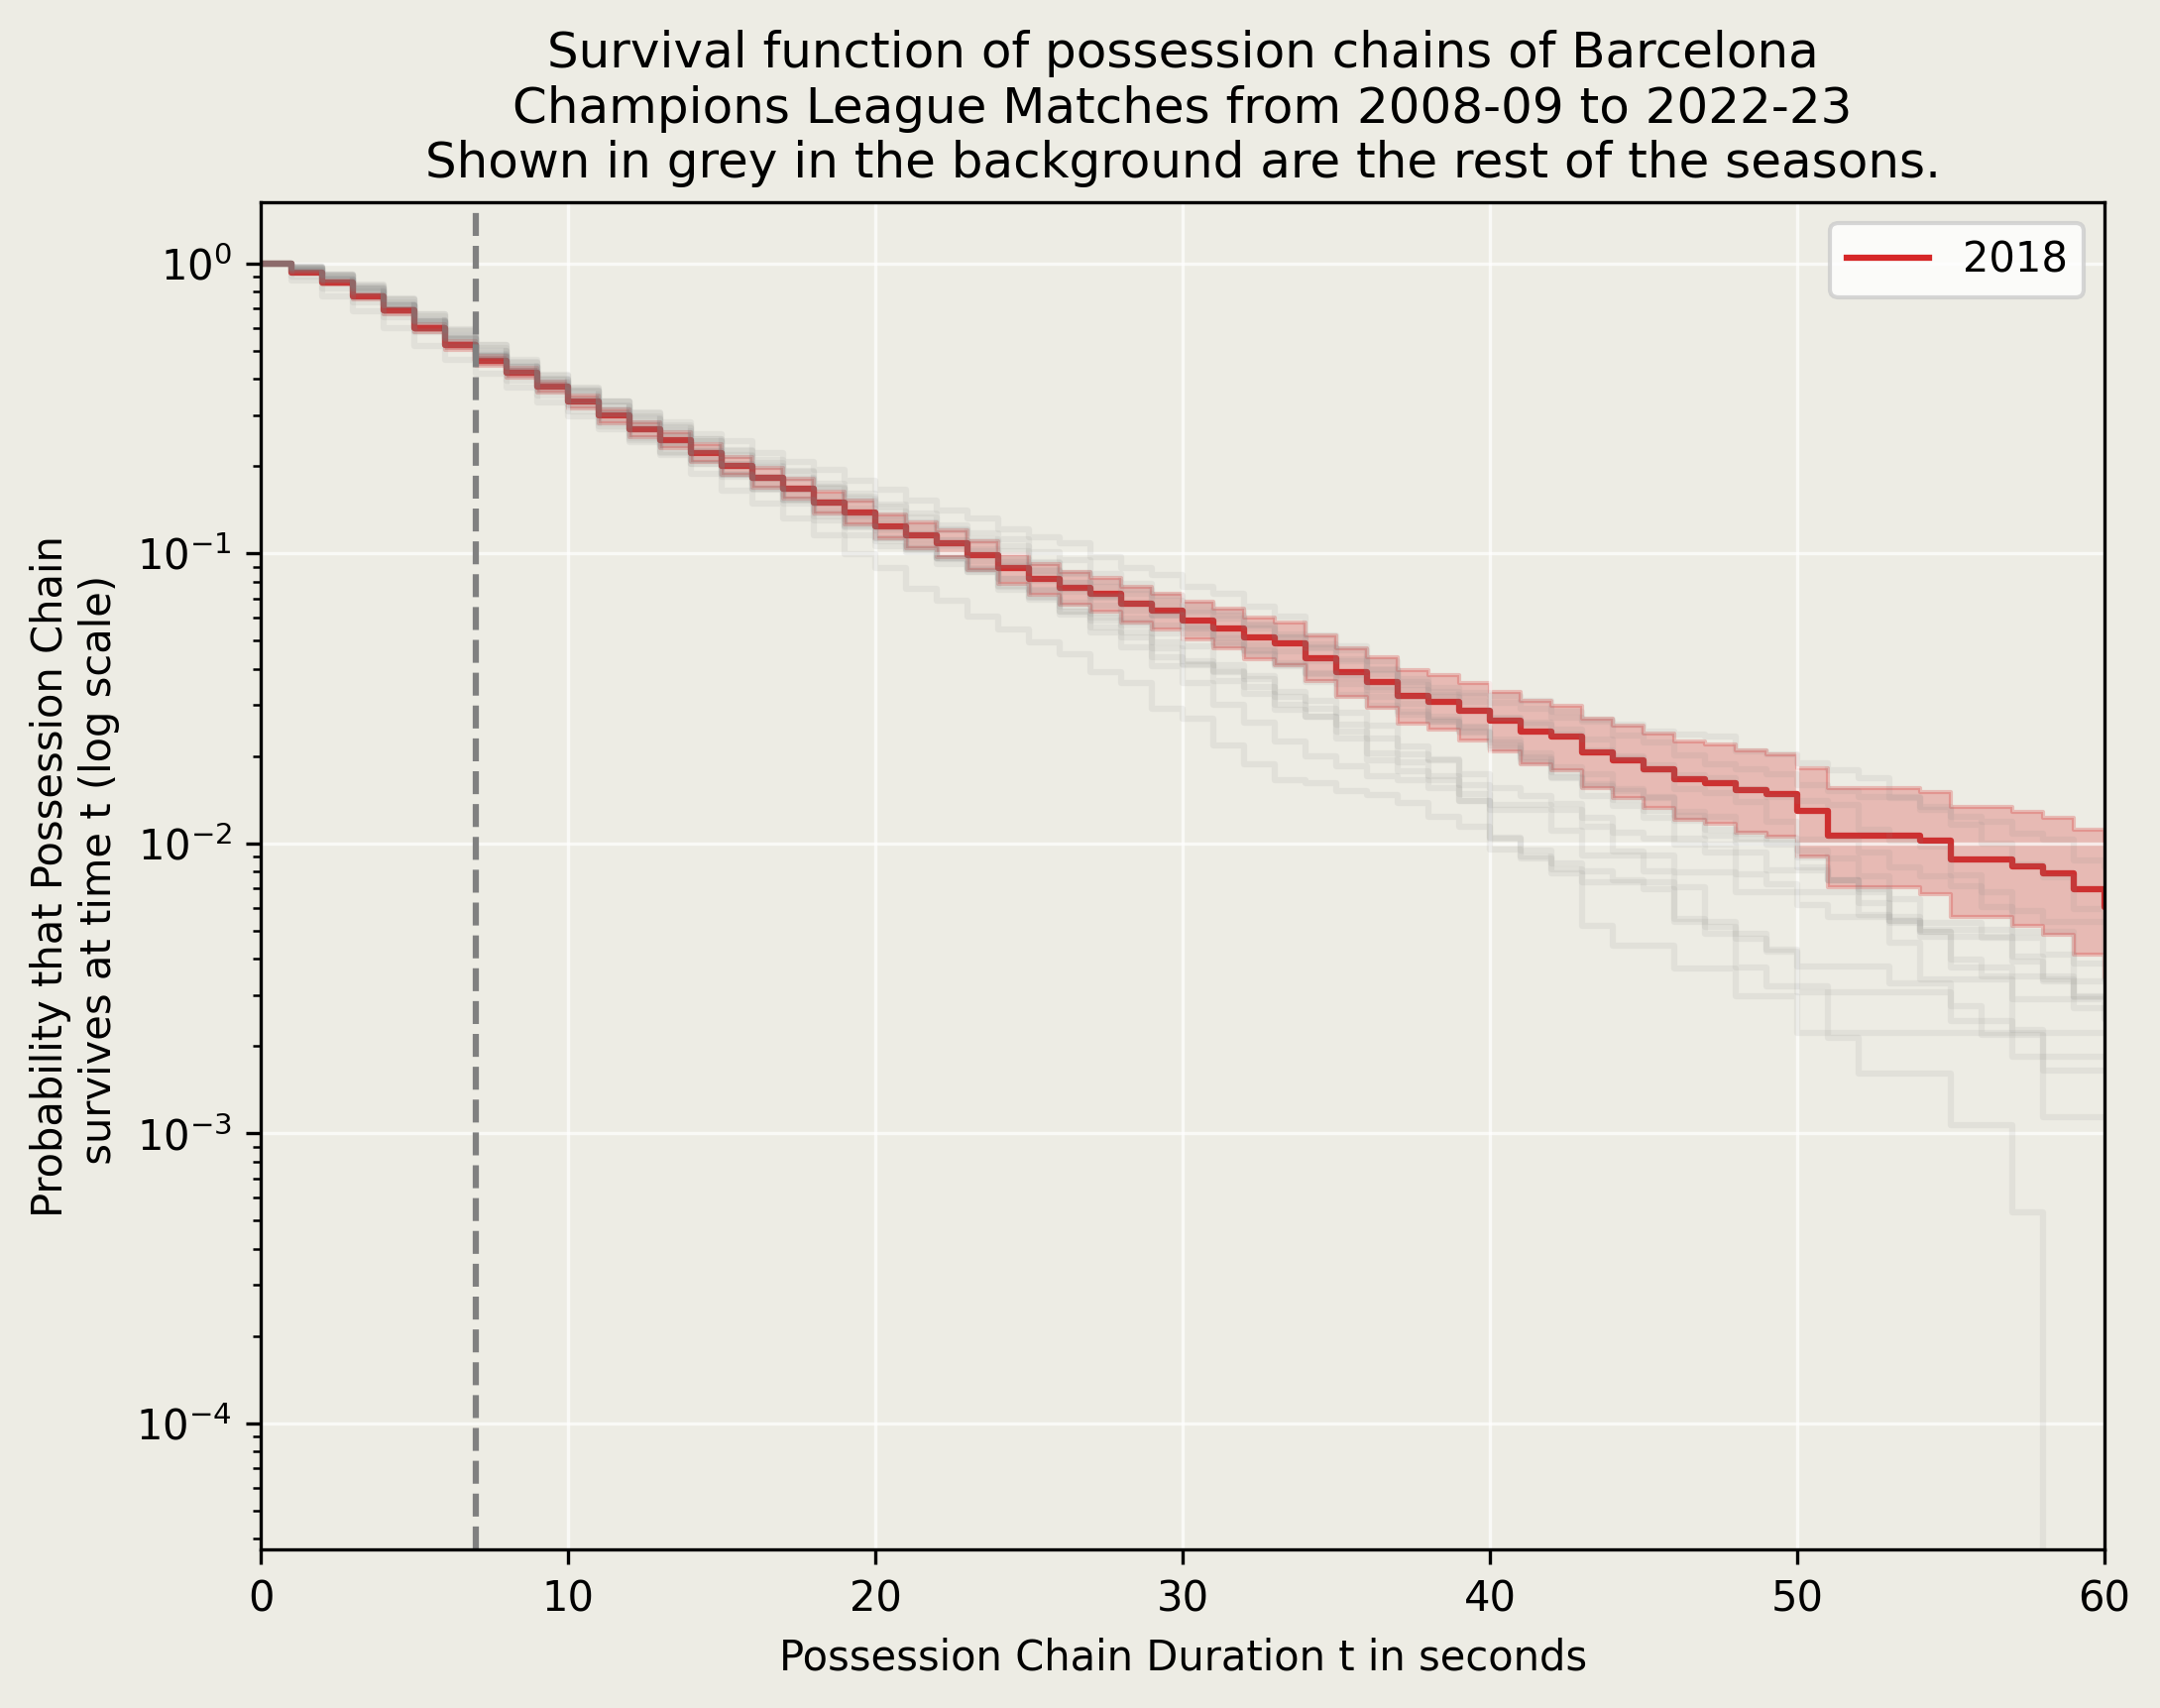
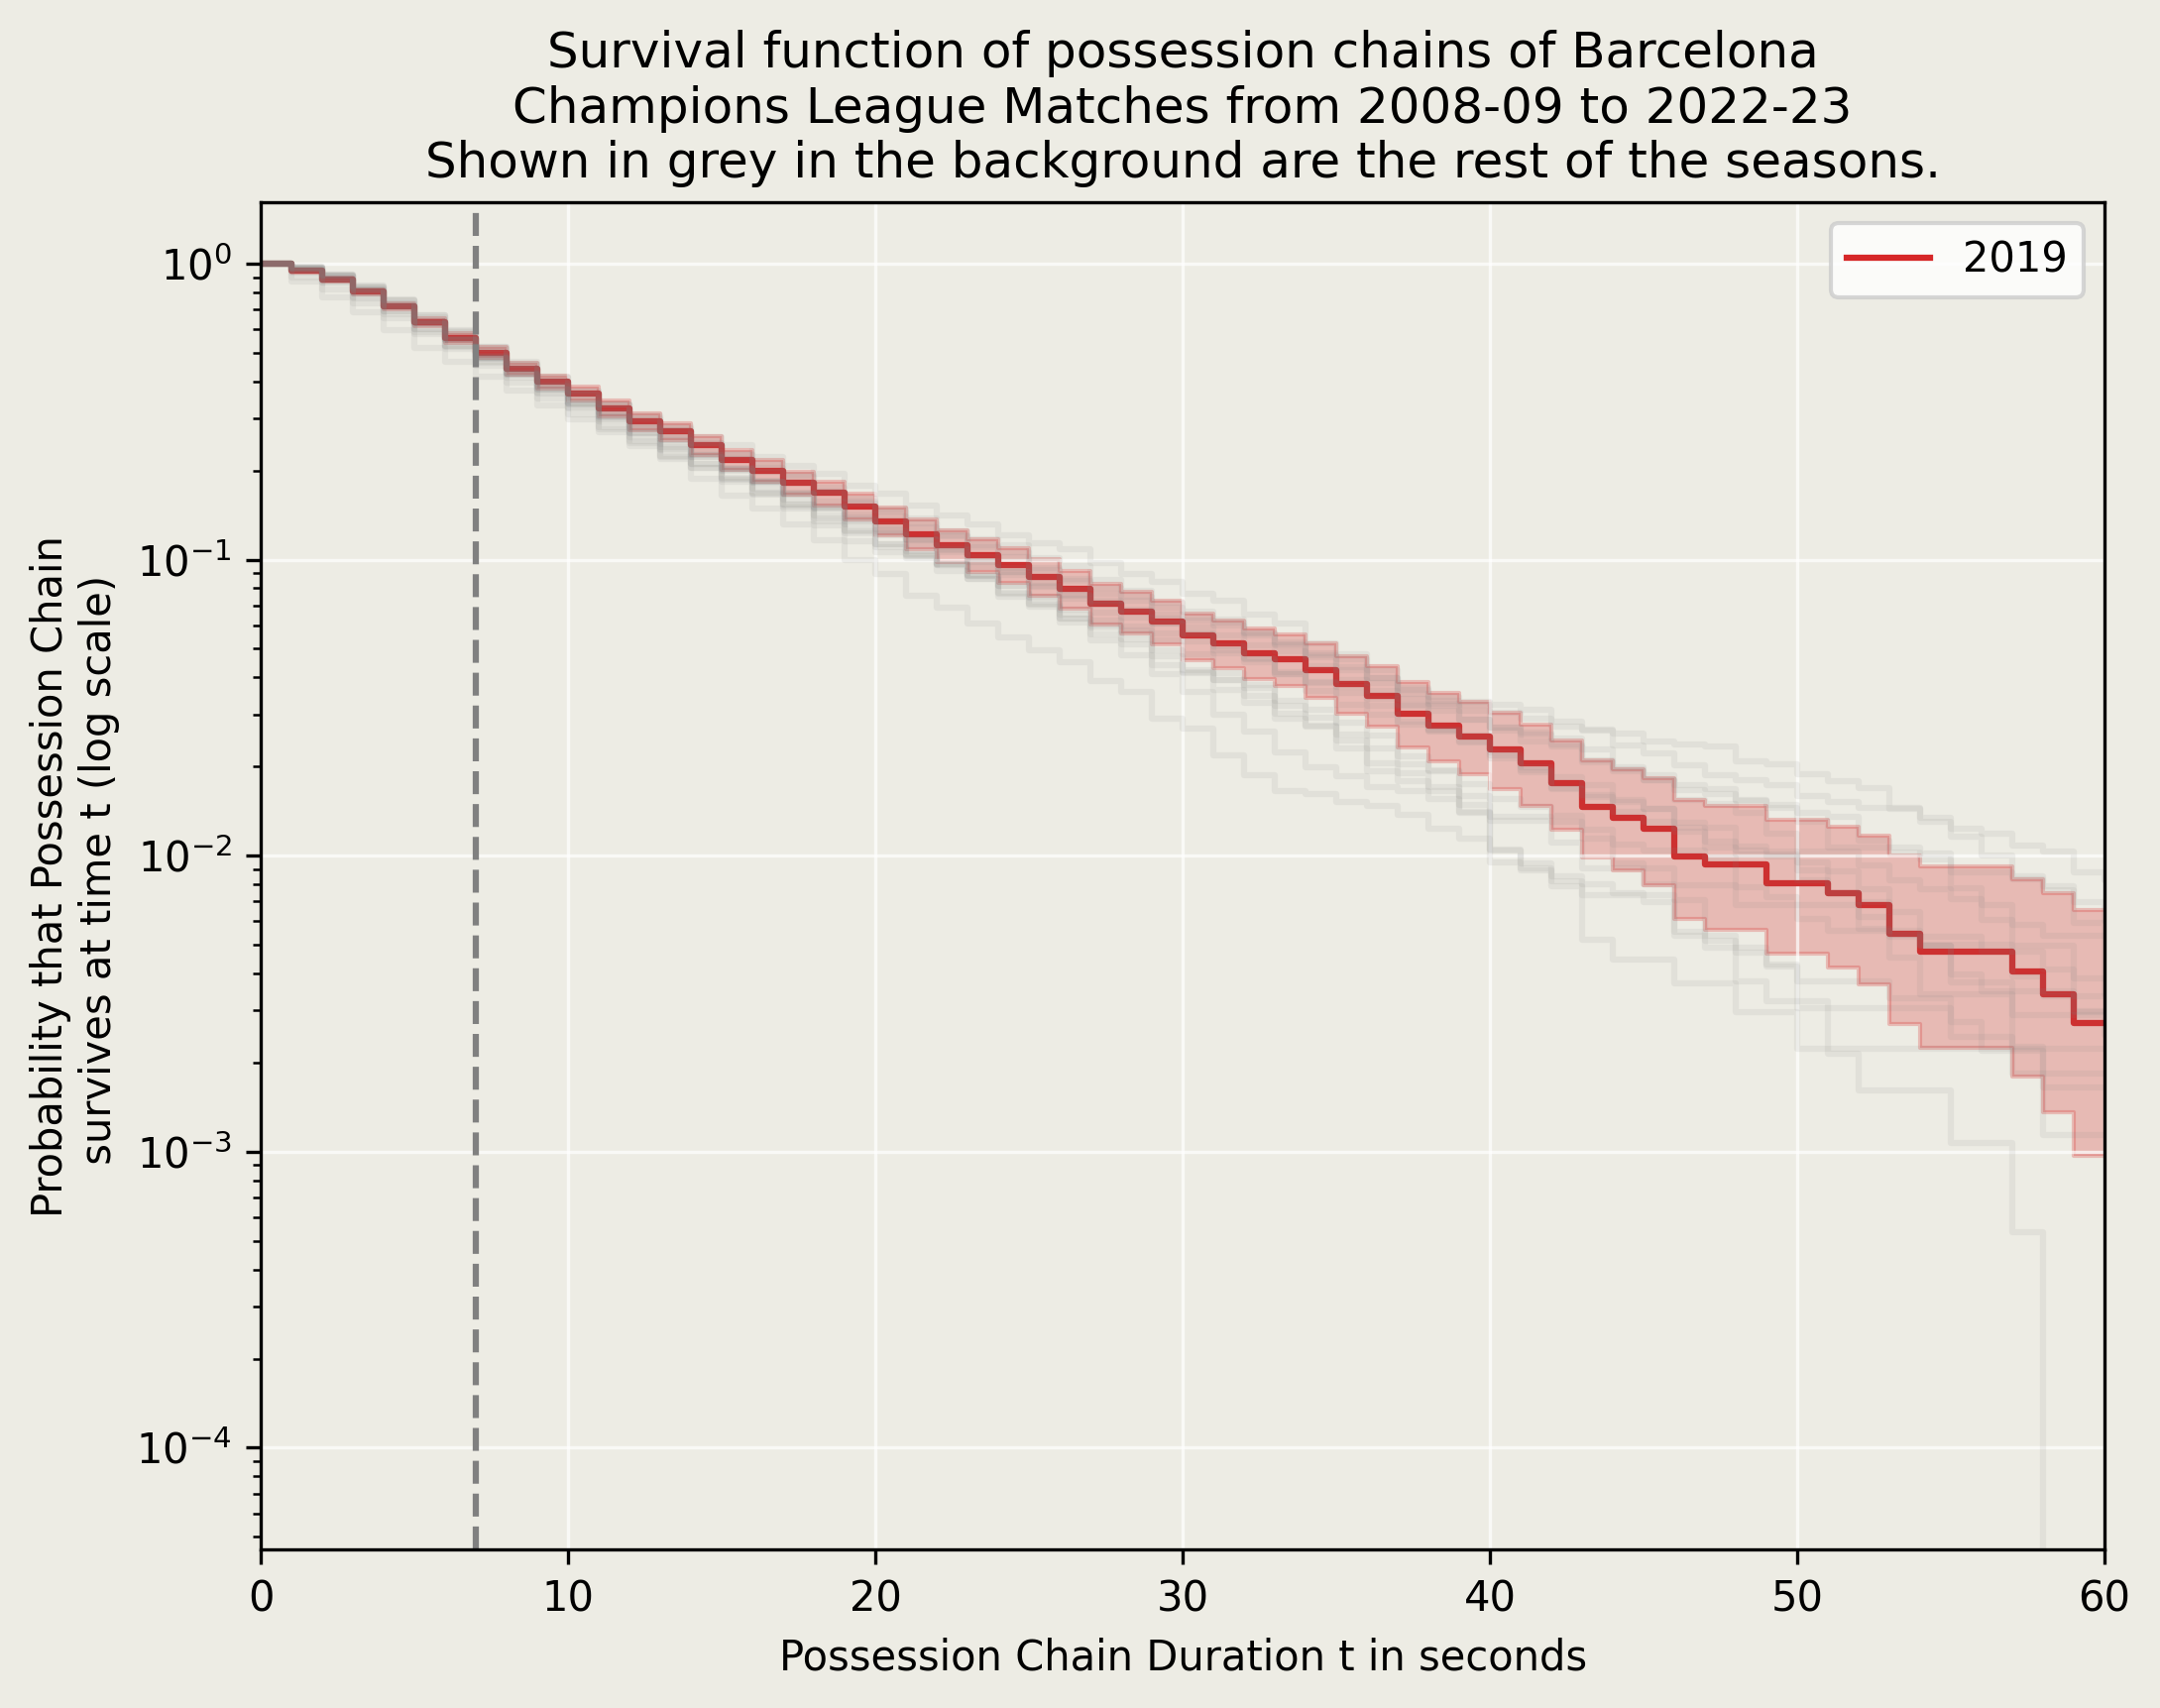
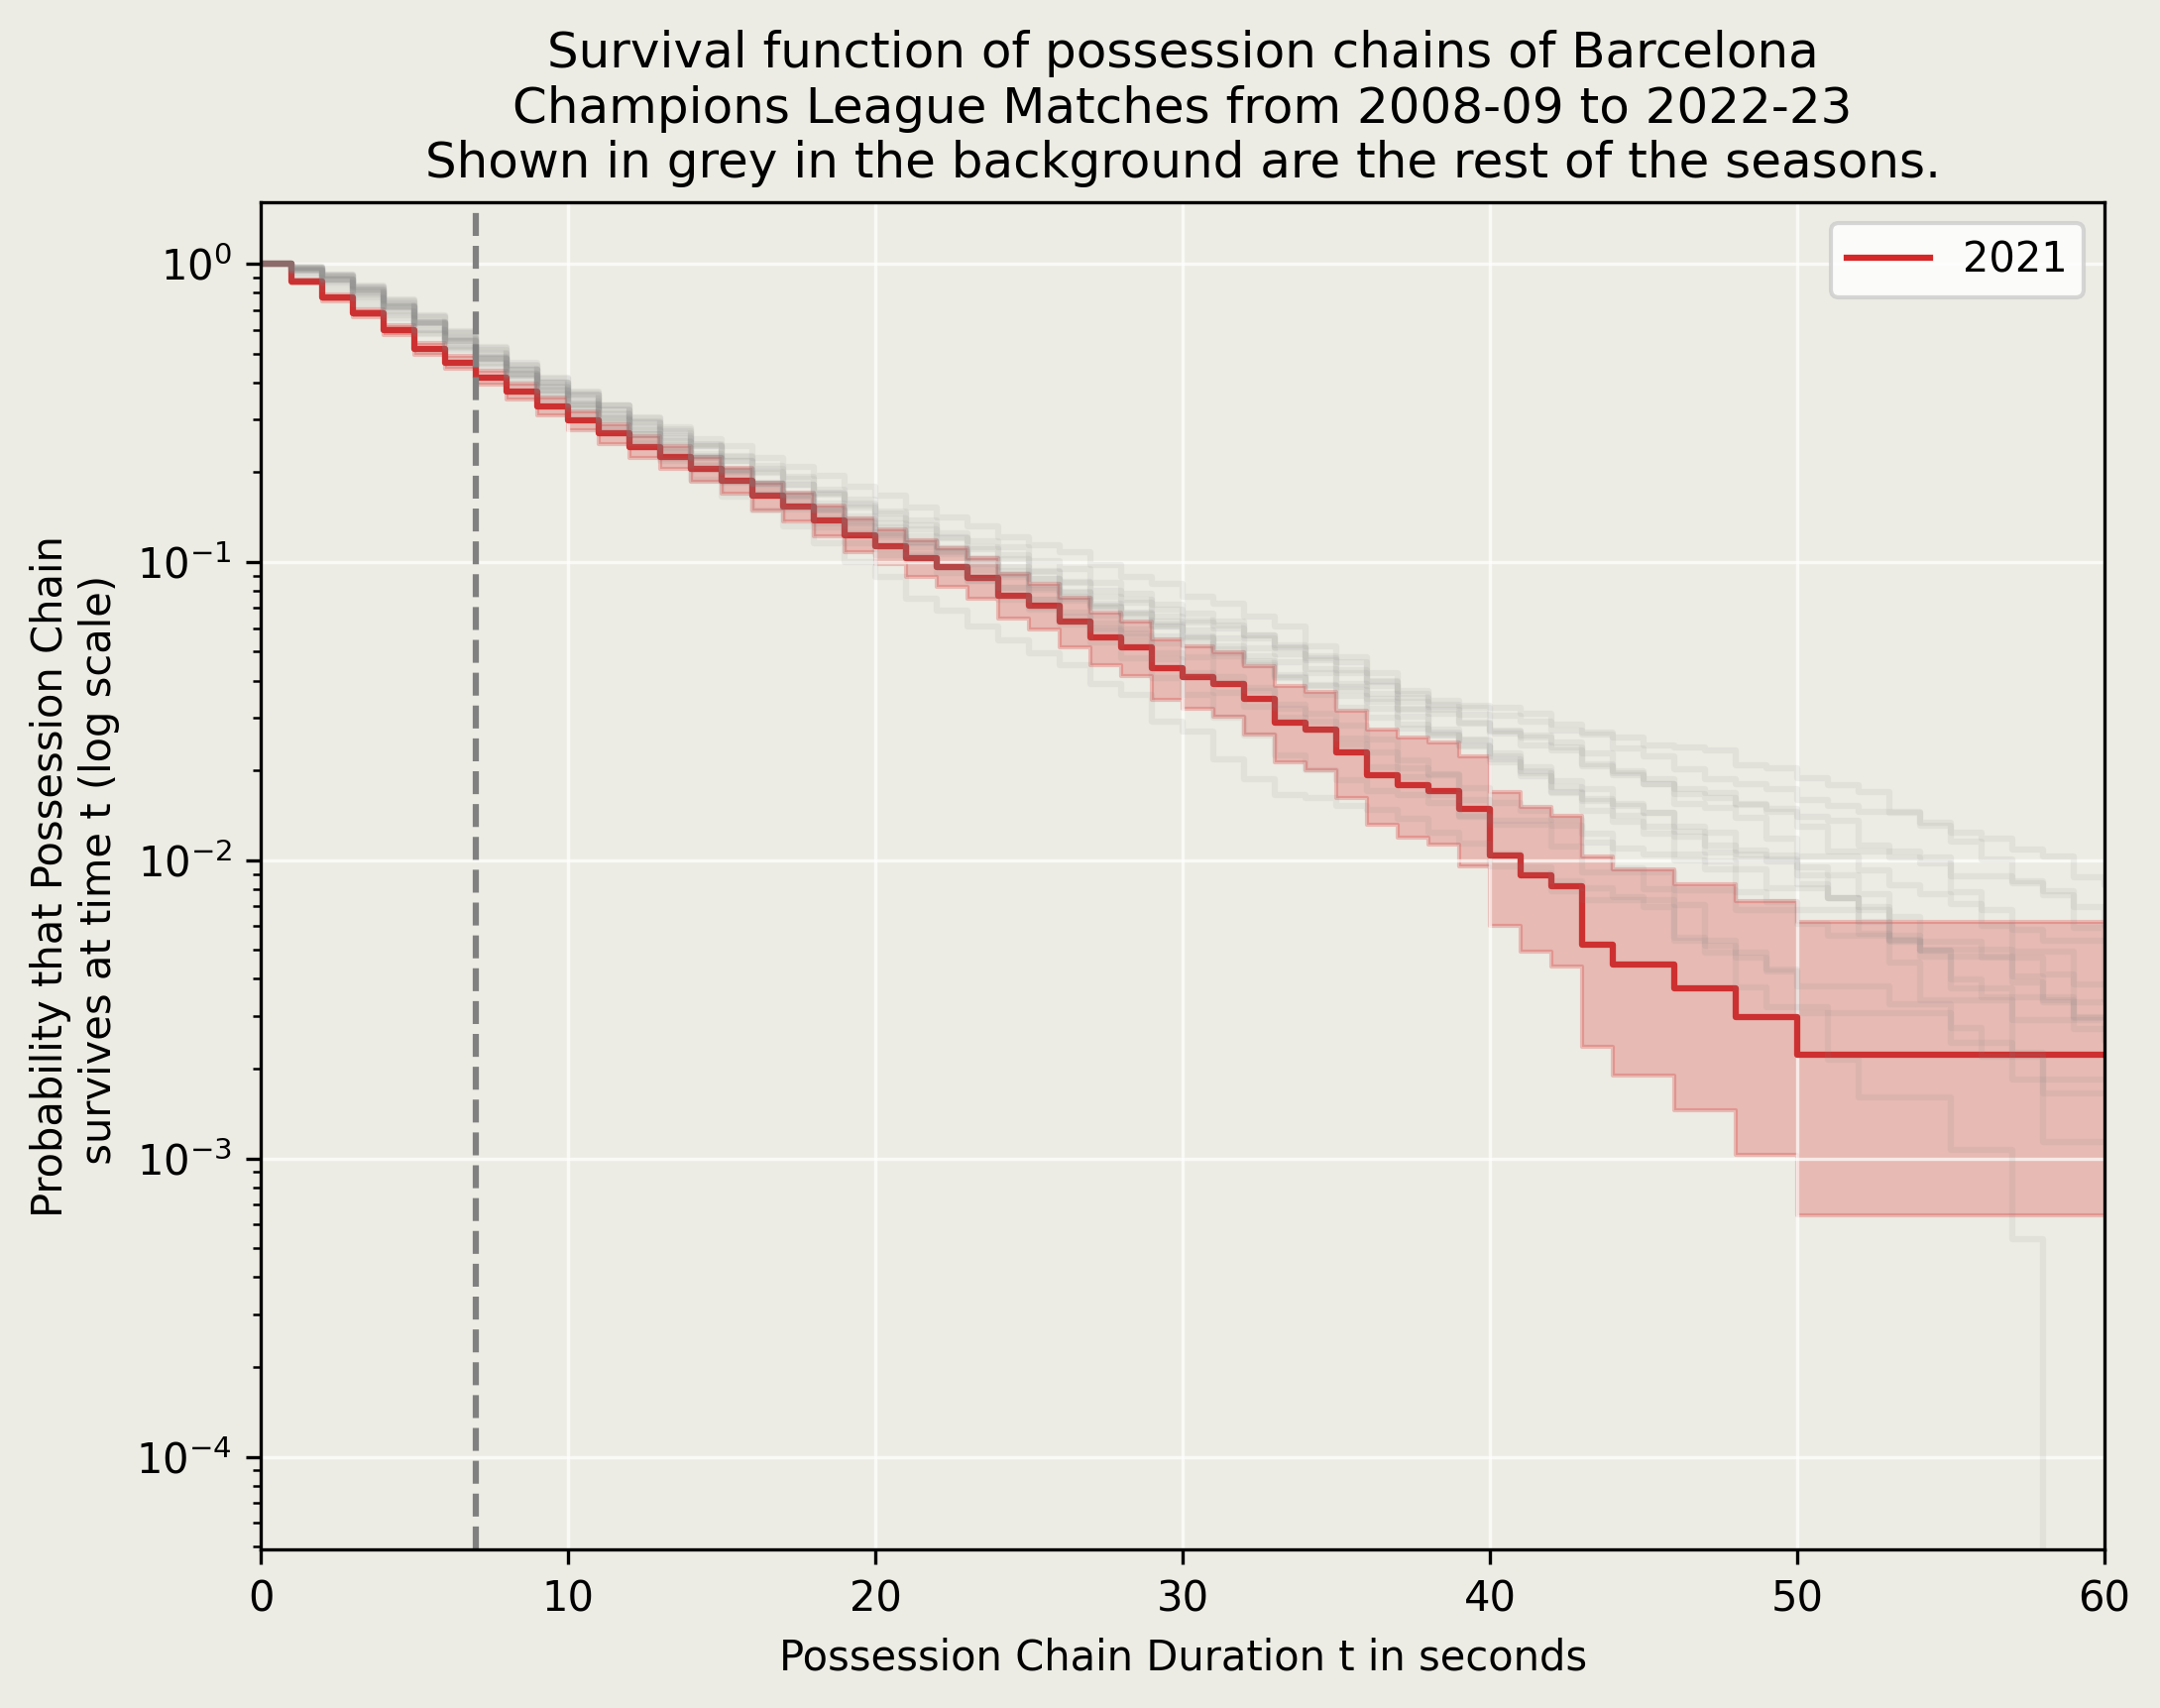
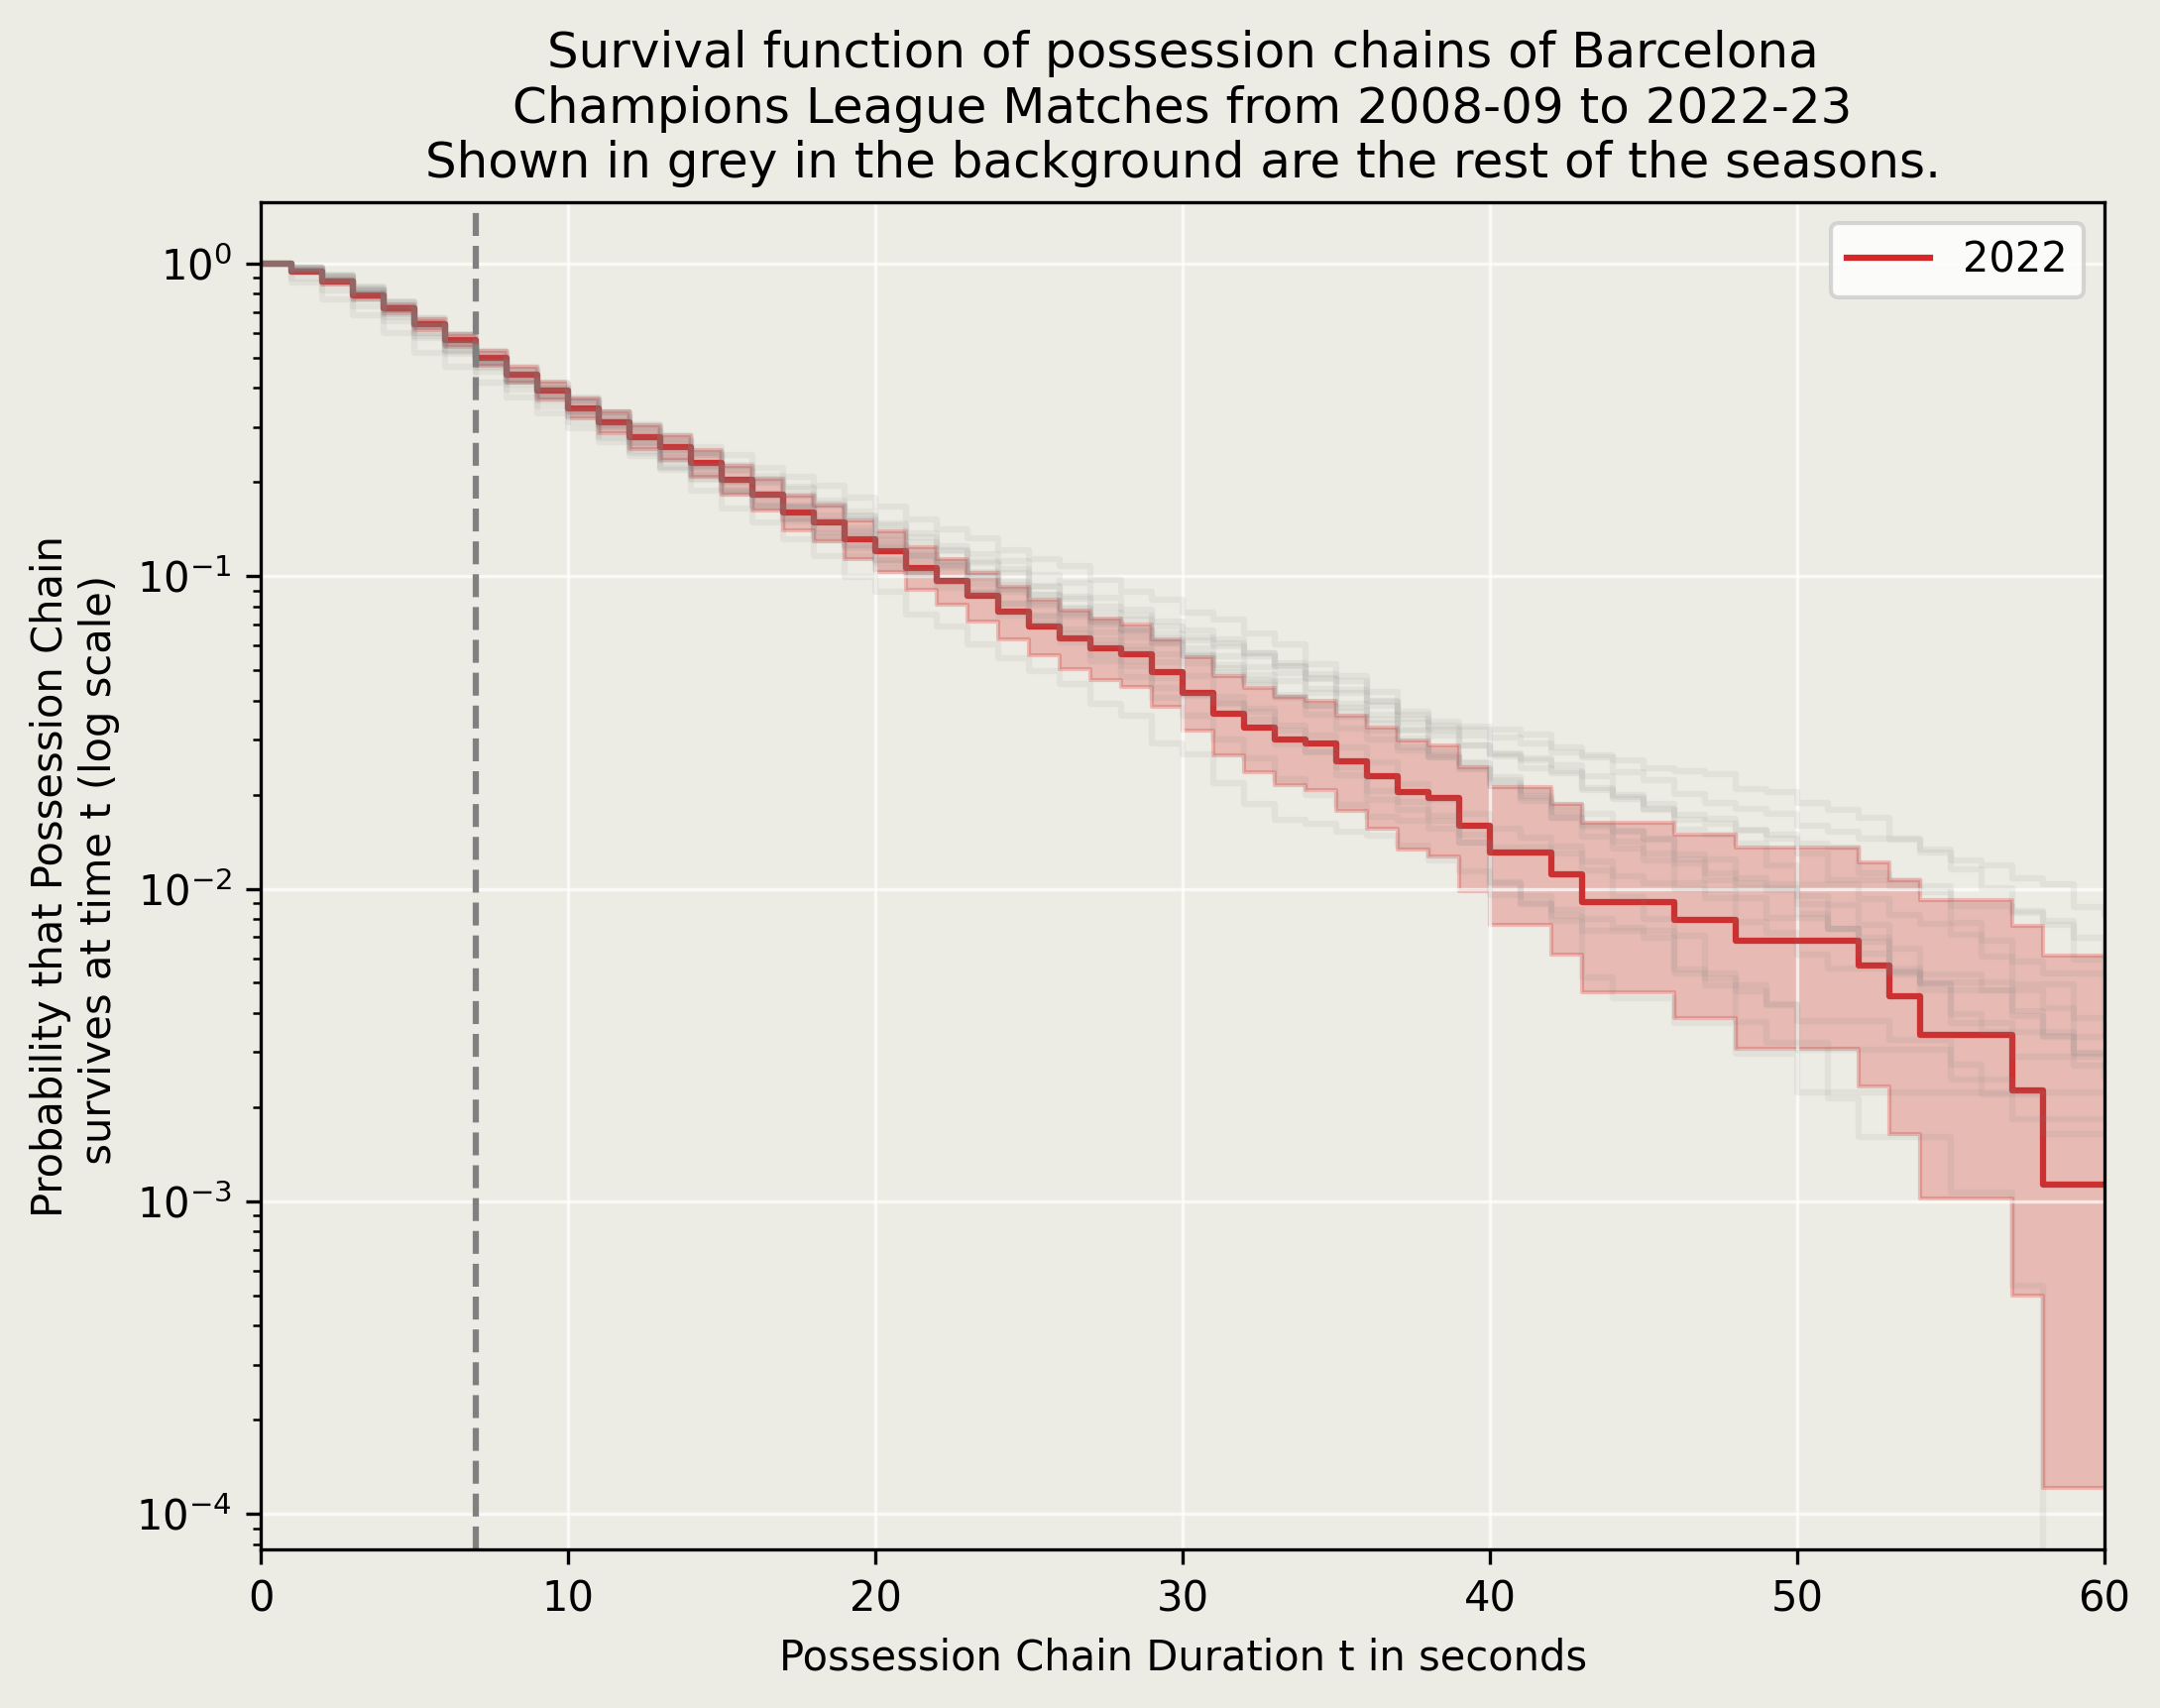
Now, perhaps that gif in the beginning was too fast for you. Here I am going to show in details the survival curves for each season separately. These are the Kaplan-Meier survival curves I mentioned in the previous section.
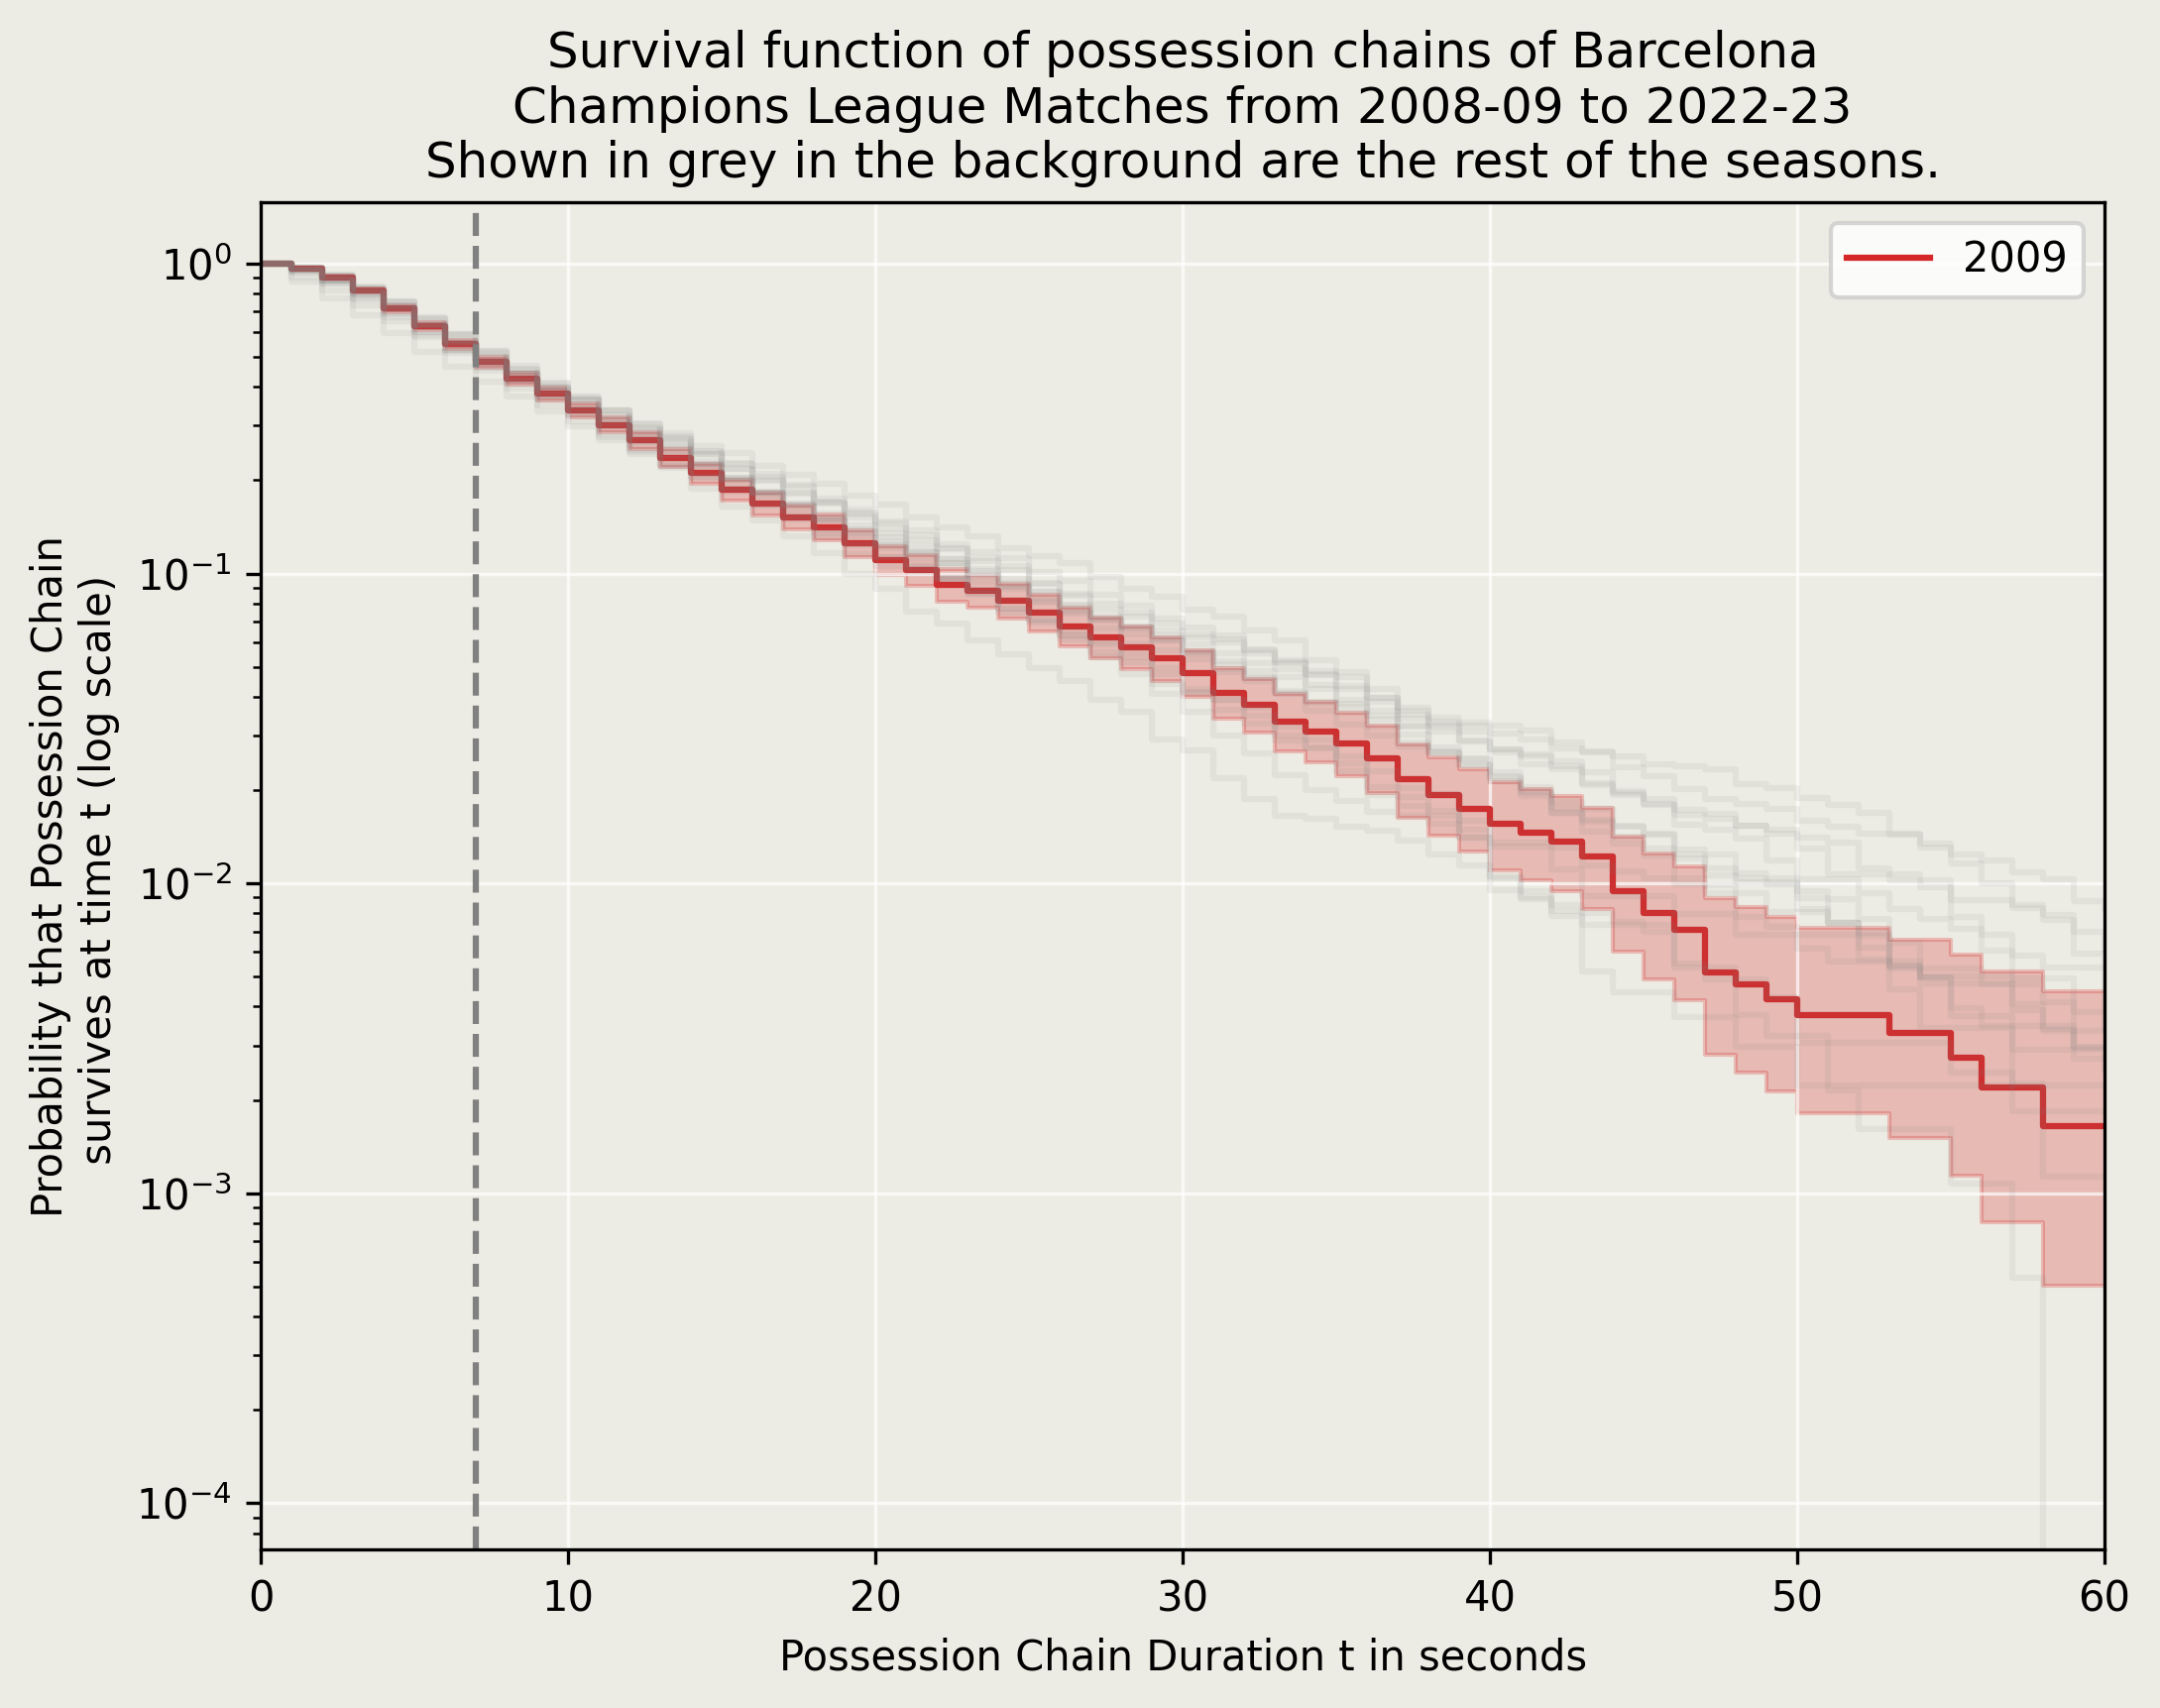
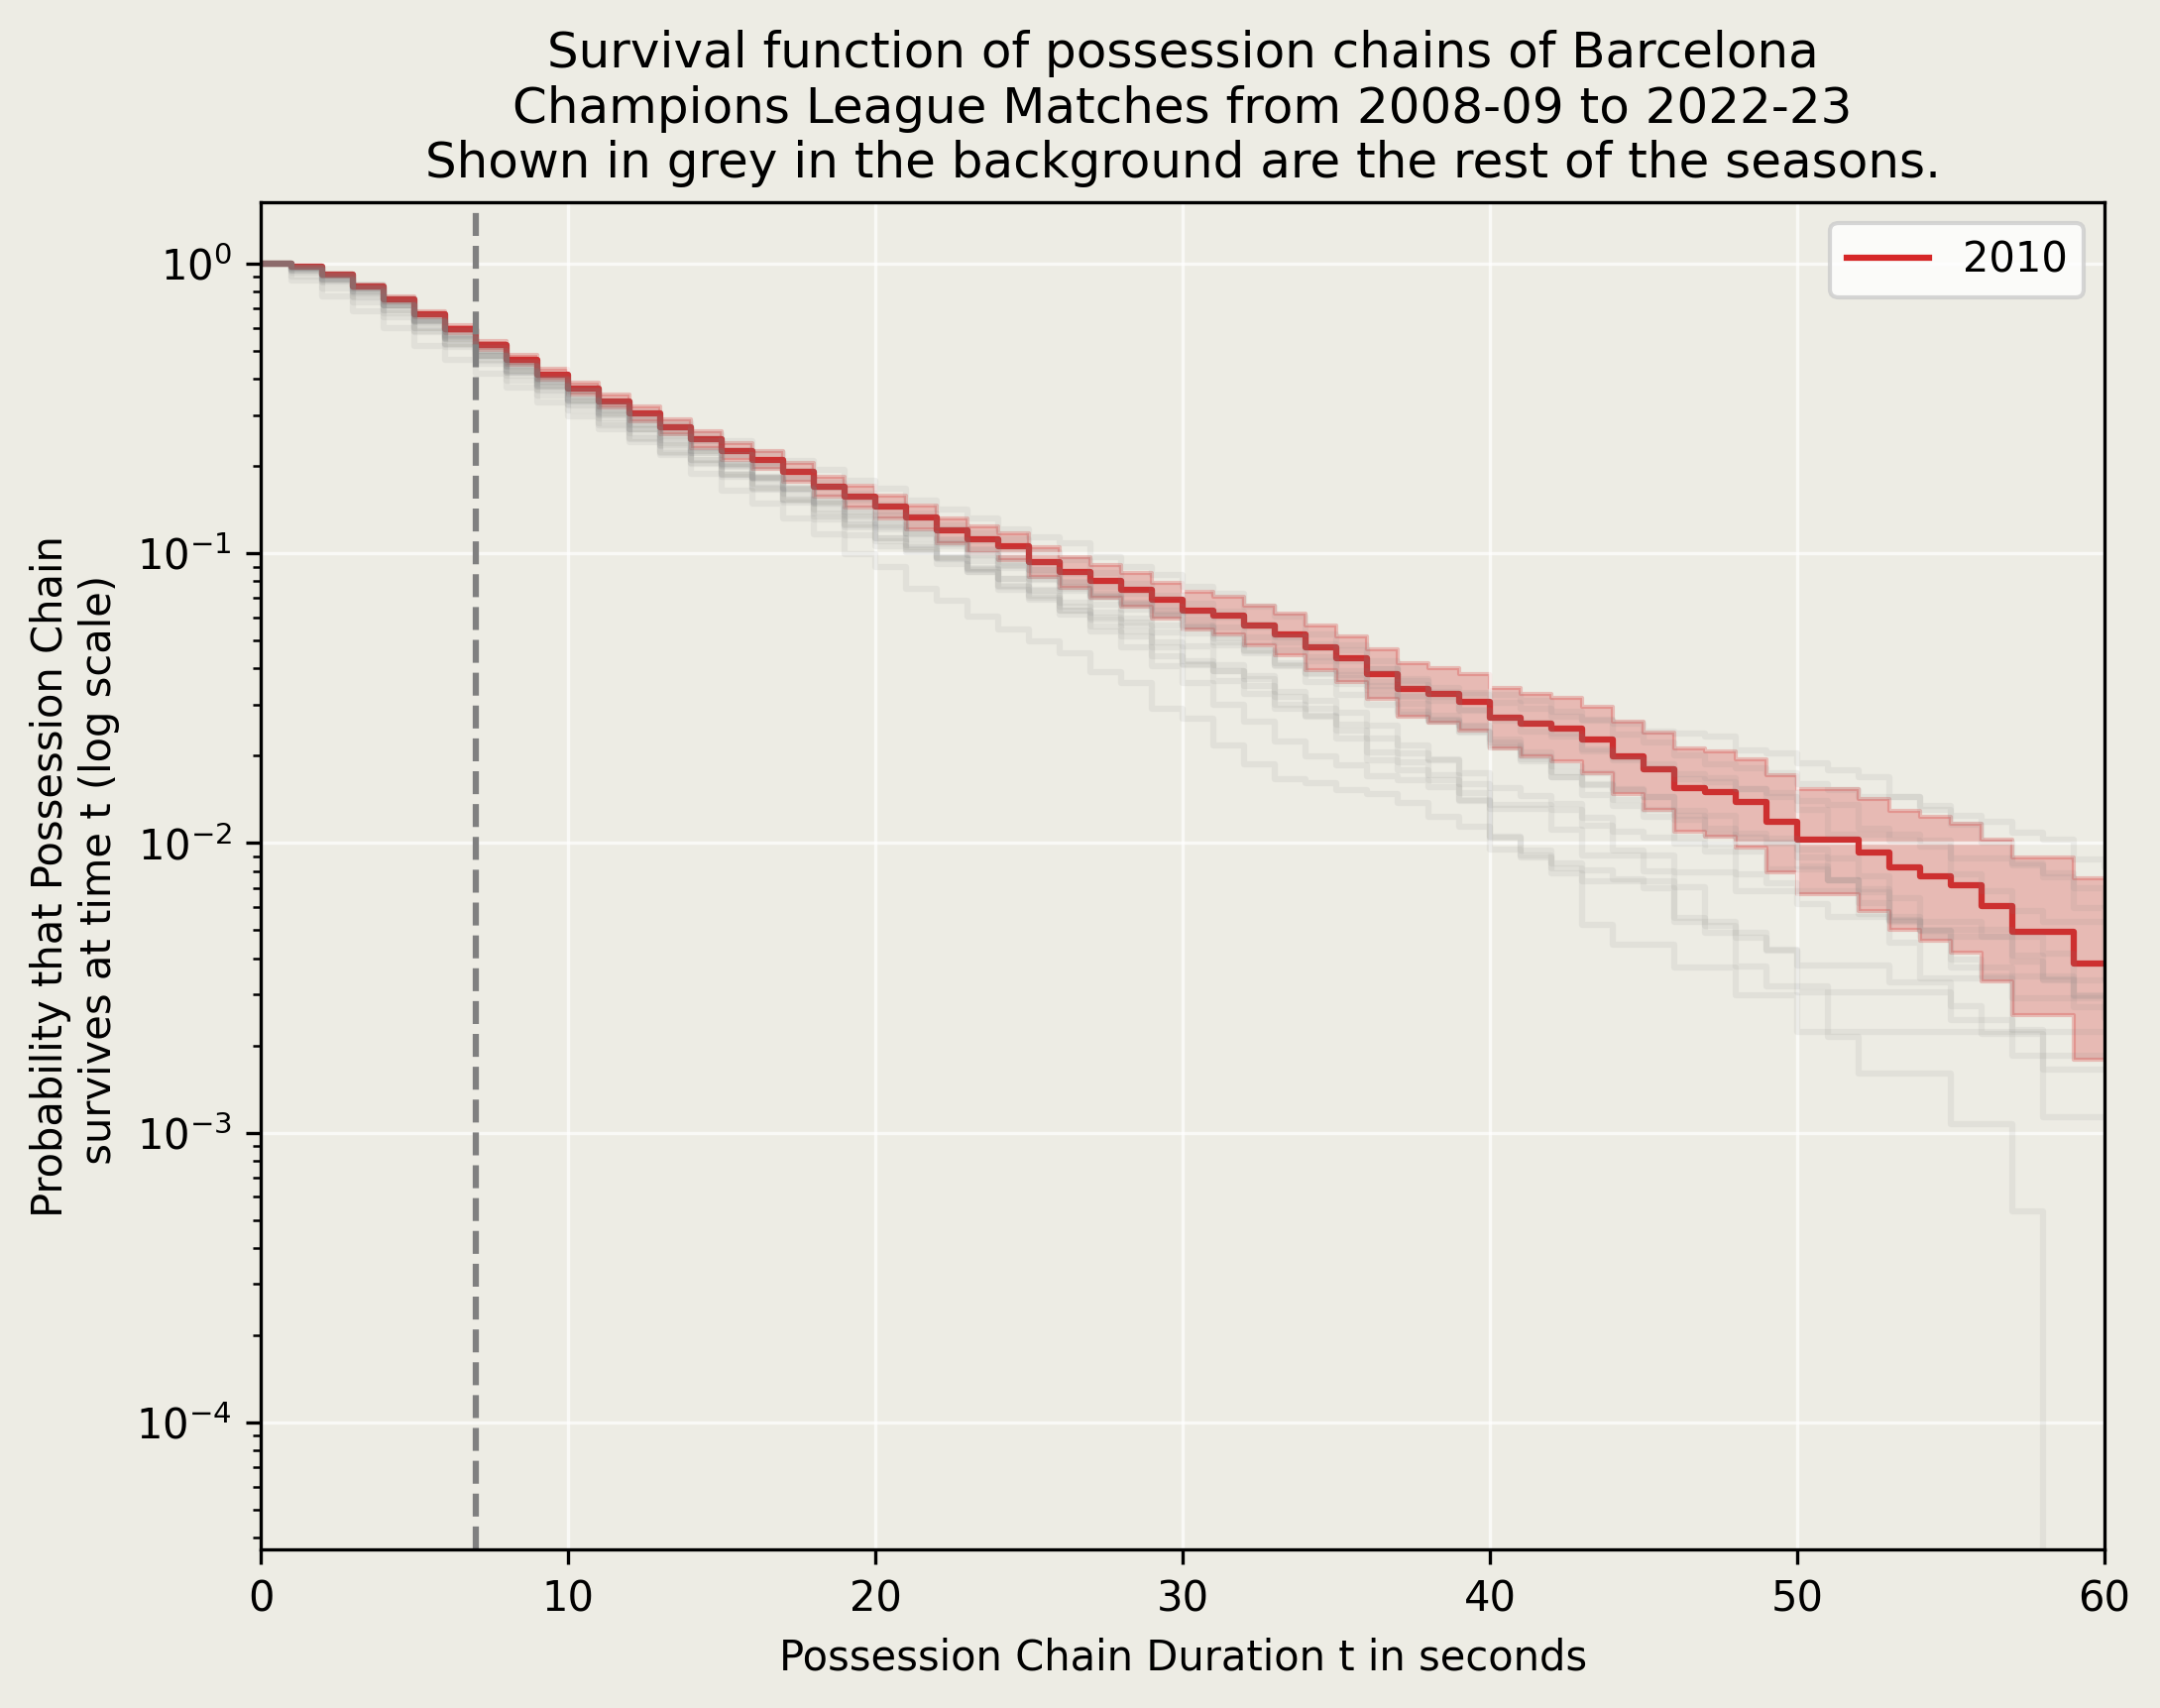
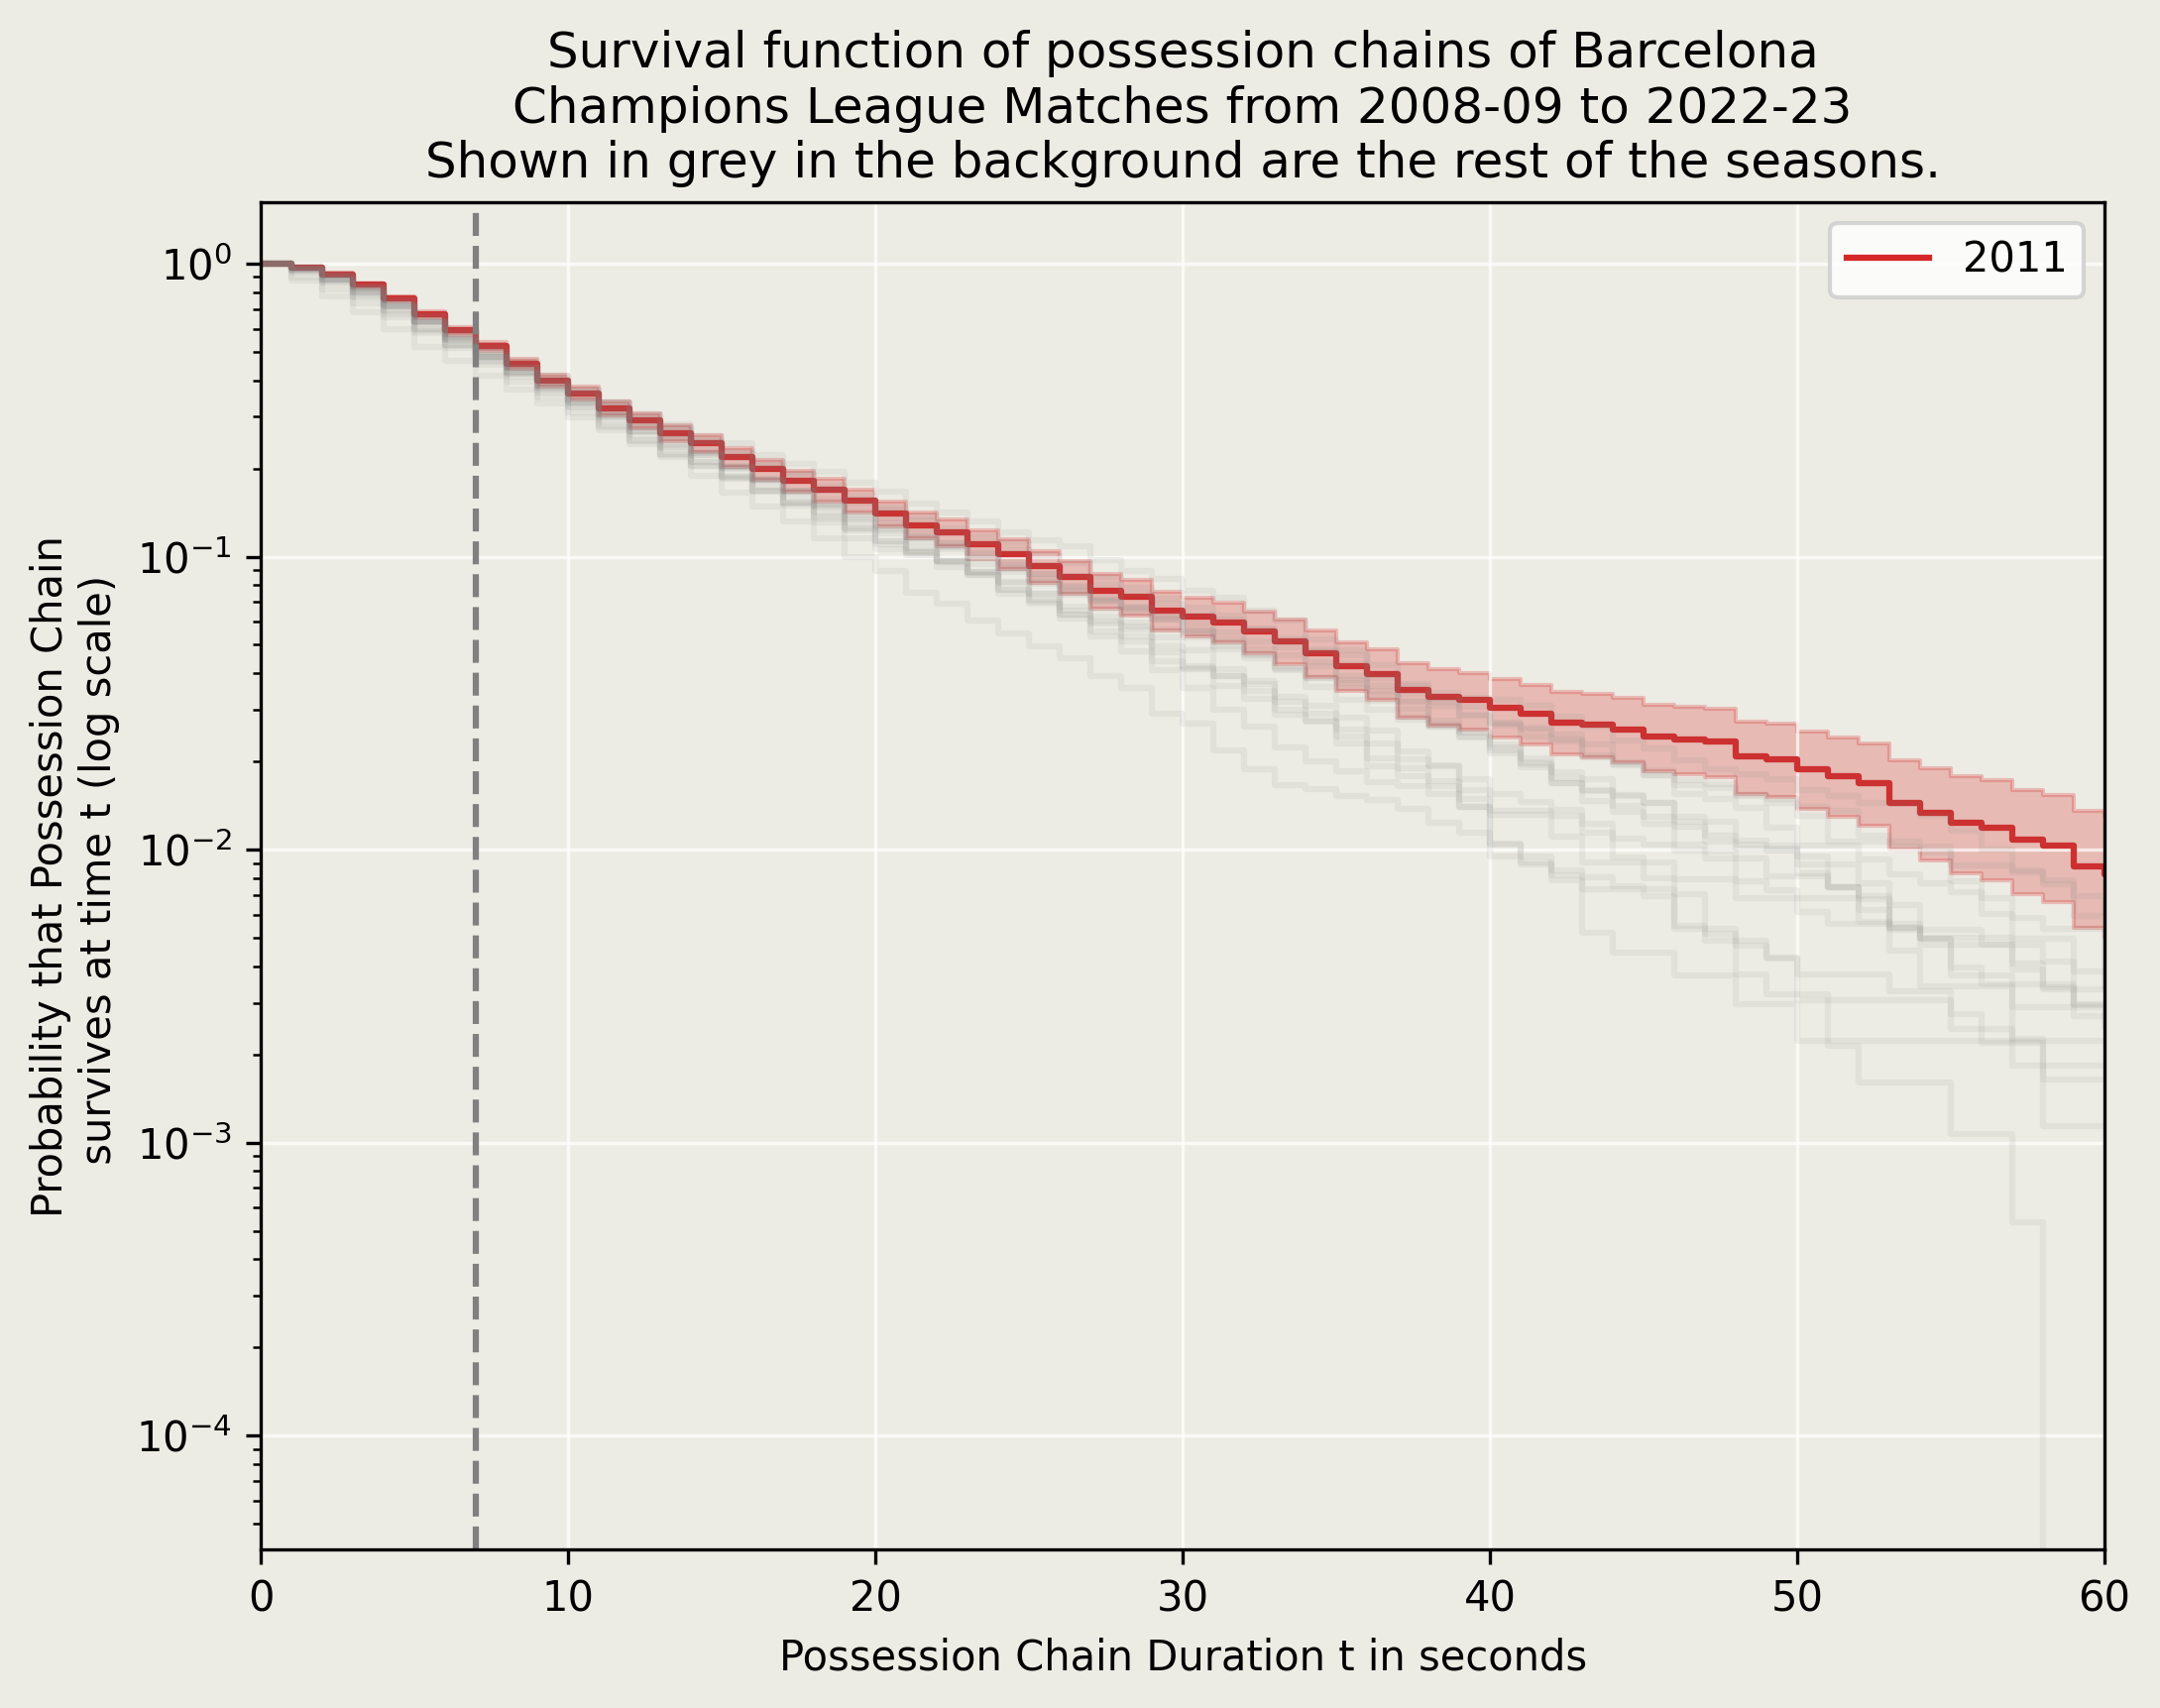
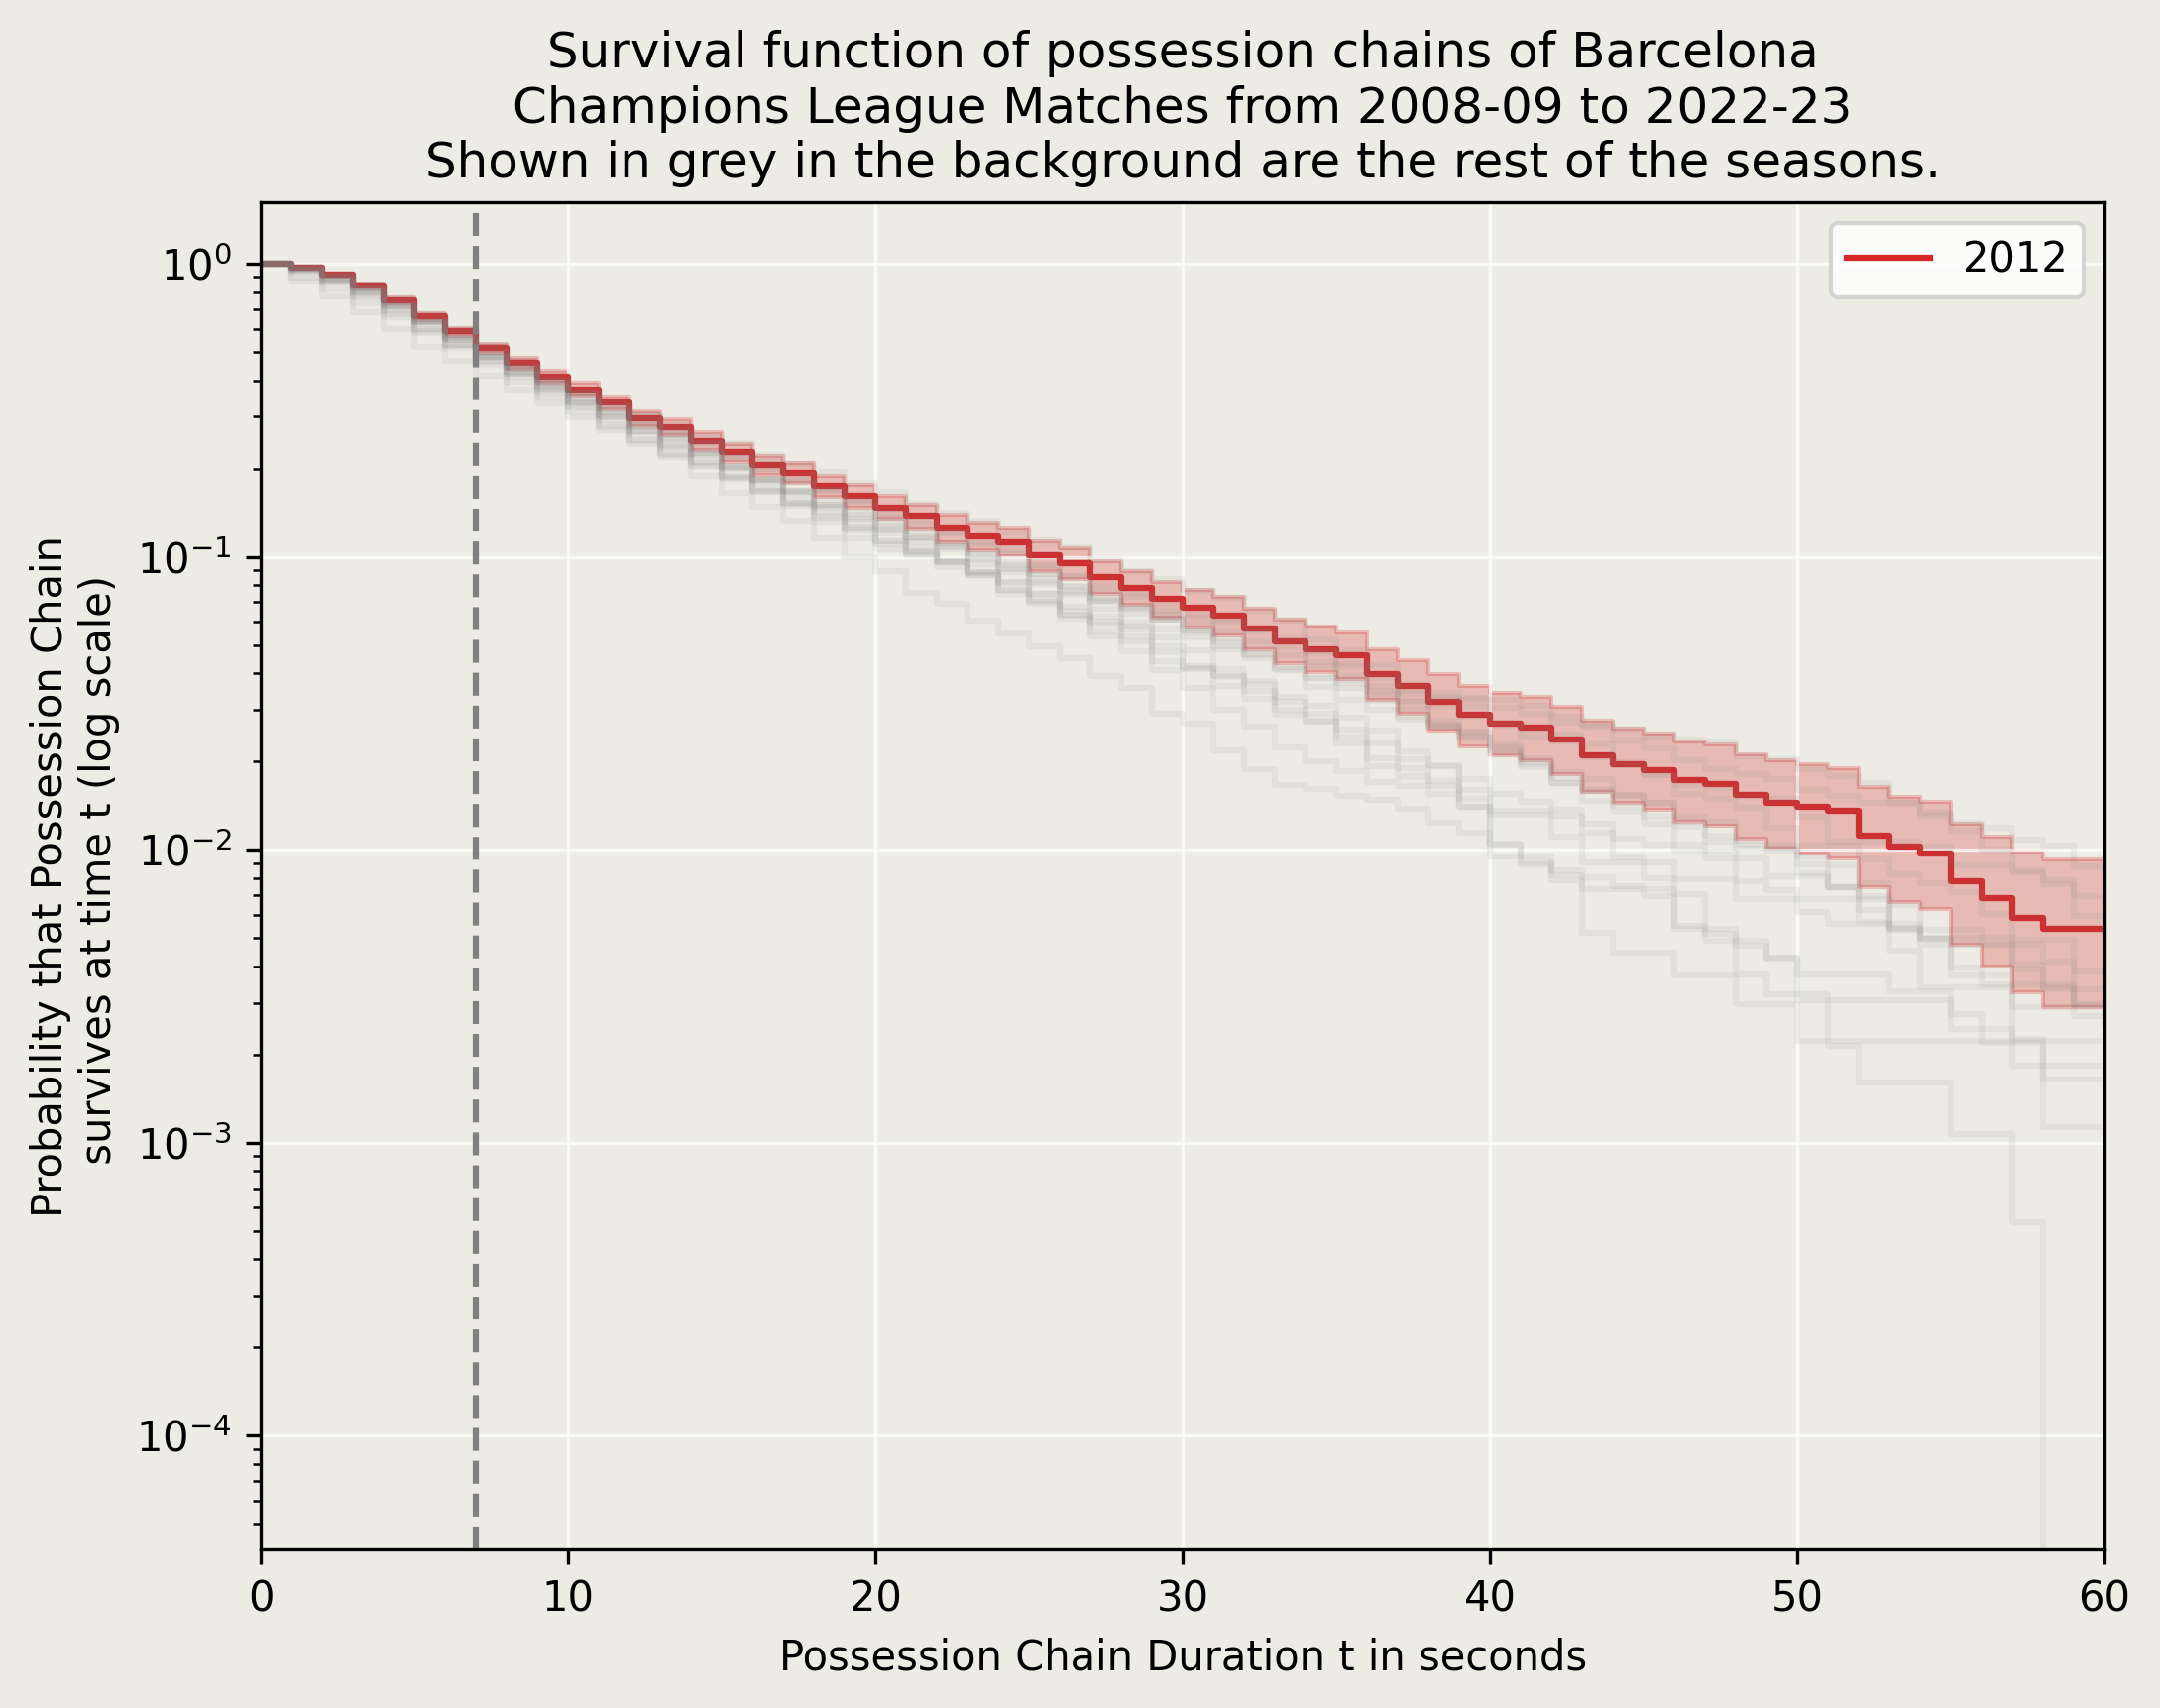
The Glory Years under Pep Guardiola from 2008-09 to 2011-12
Guardiola slowly perfected his possession football. By the end of his tenure, it was pretty much impossible to take the ball away from his well-drilled Barcelona machine. In the words of Sir Alex Ferguson, “… It was Iniesta and Xavi. They can keep the ball all night long.”
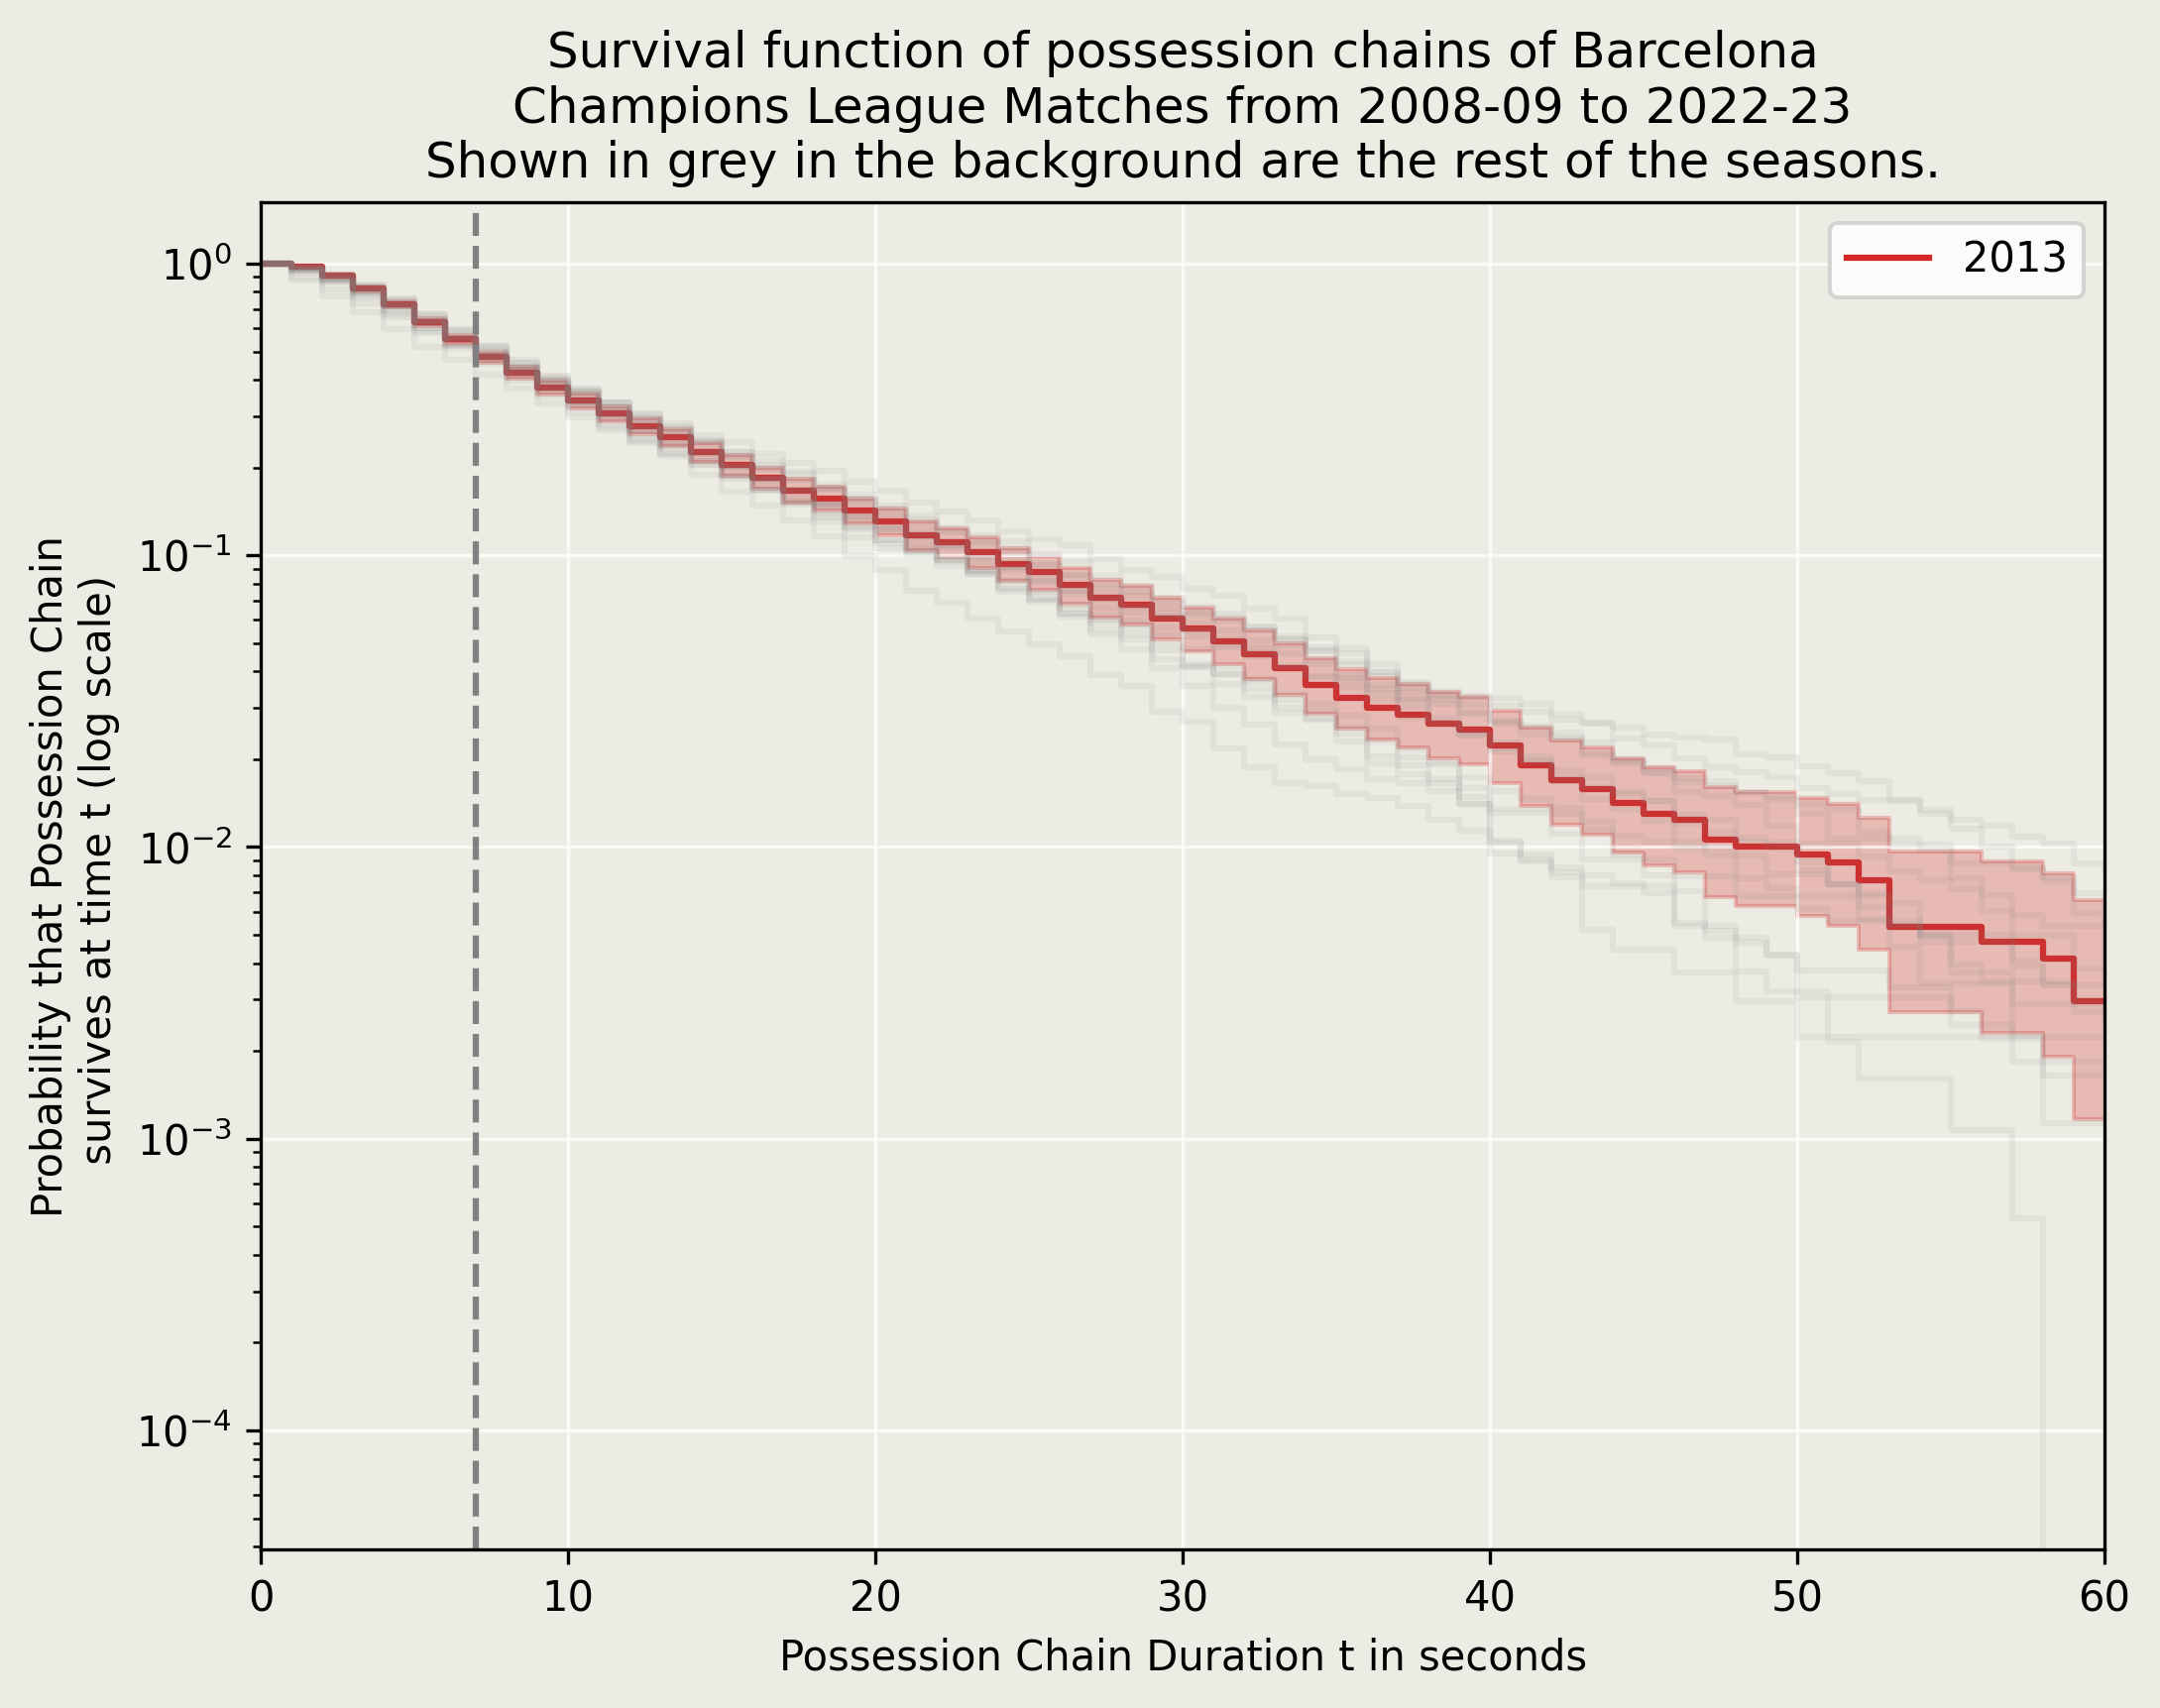
Tito Vilanova 2012-13
Guardiola’s assistant Vilanova took up the mantle after he left and carried on the good work. Then, the cruel monster named life struck - and took Tito away from us 😢
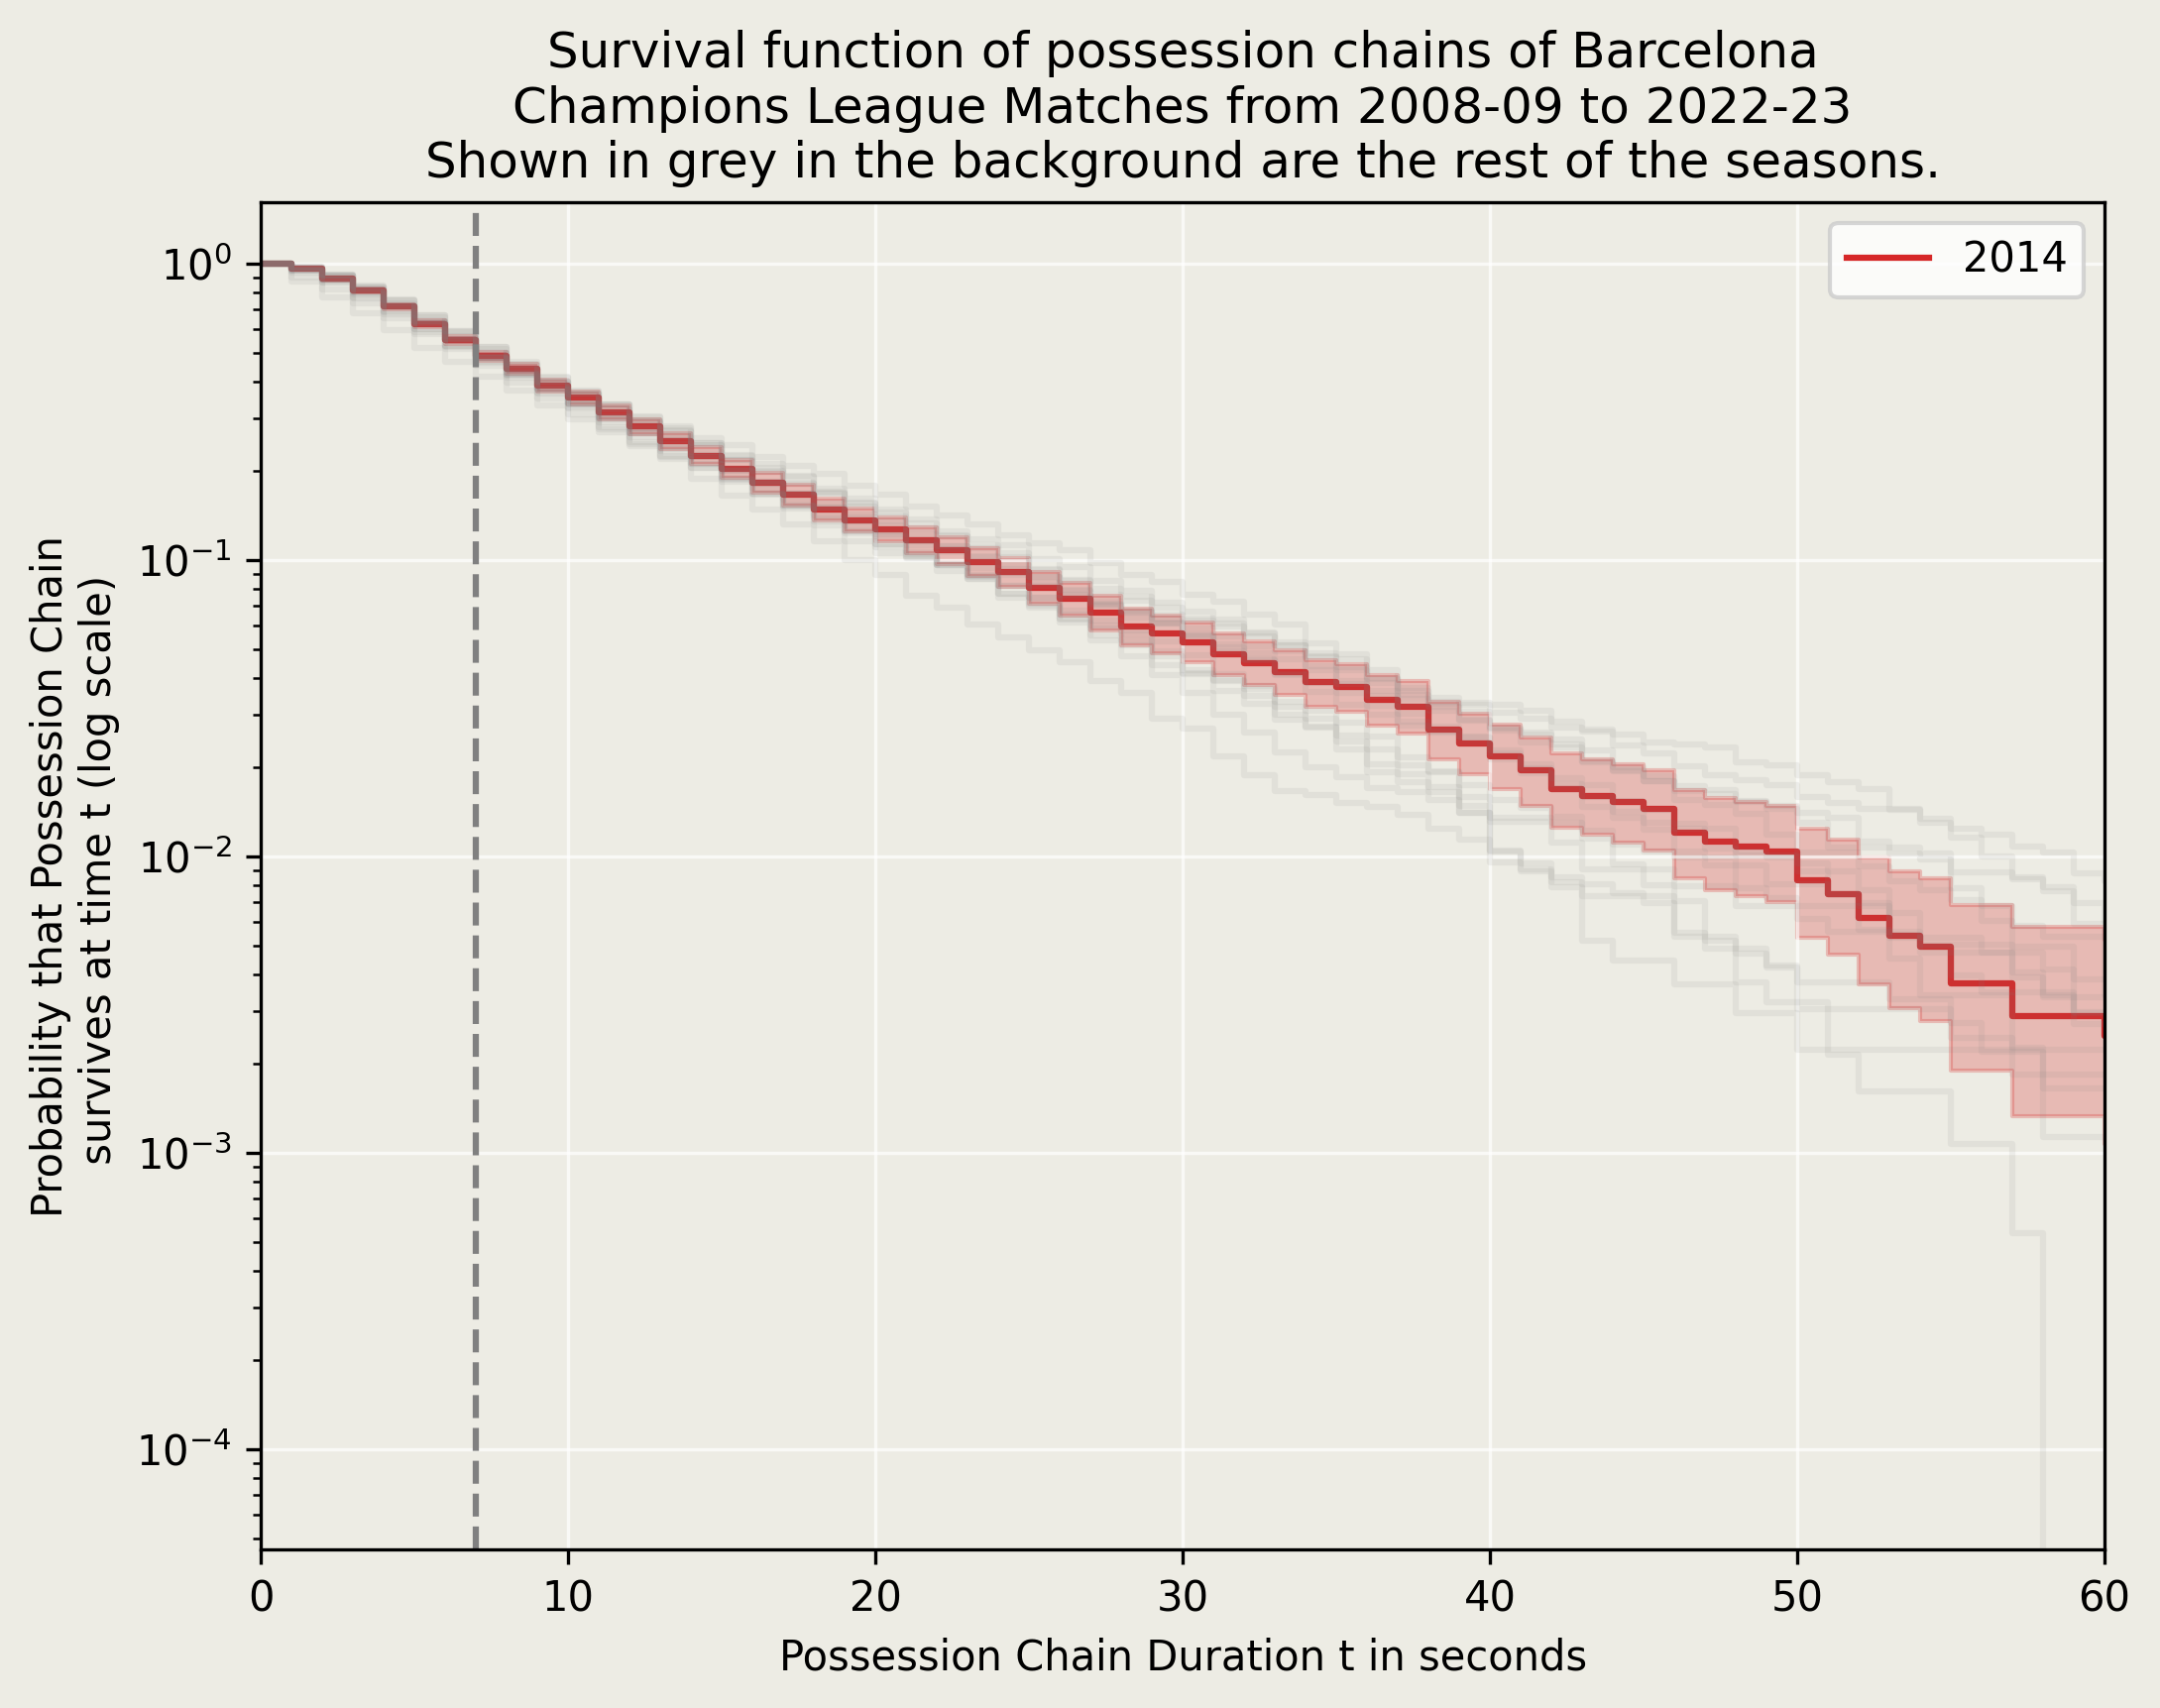
Tata Martino 2013-14
Gerardo “Tata” Martino started brightly, but after a game where Barcelona were out-possessed (still won though), he faced heavy criticism. His football changed quite a bit then, lacking penetration in the final phases.
Luis Enrique from 2014-15 to 2016-17
The second best Barcelona coach (in my opinion) among the coaches I saw live. Enrique started his tenure as brightly as Pep with a treble, but poor decisions hurt the end of his tenure badly.
Ernesto Valverde from 2017-18 to middle of 2019-20, Quique Setien for the rest of 2019-20
The ultimate pragmatic manager, Valverde did fairly well in his Barcelona stint in getting the best out of the aging spine of the team. However, key failures in CL led to his ultimate dismissal. His replacement Setien only managed Barcelona in 2 CL games, the 2-8 drubbing at the hands of Bayern Munich an infamous blot in his career.
Ronald Koeman from 2020-21 to middle of 2021-22, Xavi from 2021-22 to 2022-23
The legend of 1992, from Cruyff’s legendary Dream Team, joined Barcelona as a coach. I have very mixed opinions about his campaign. After he got fired, yet another Barcelona legend, Xavi Hernandez himself, joined as the coach. However, while Barcelona has done well in the league under him, CL success remains elusive. These are the only two coaches in recent history under whom Barcelona has slipped into the Europa League after failing to clear CL group stages.

Reasons why a possession chain fail
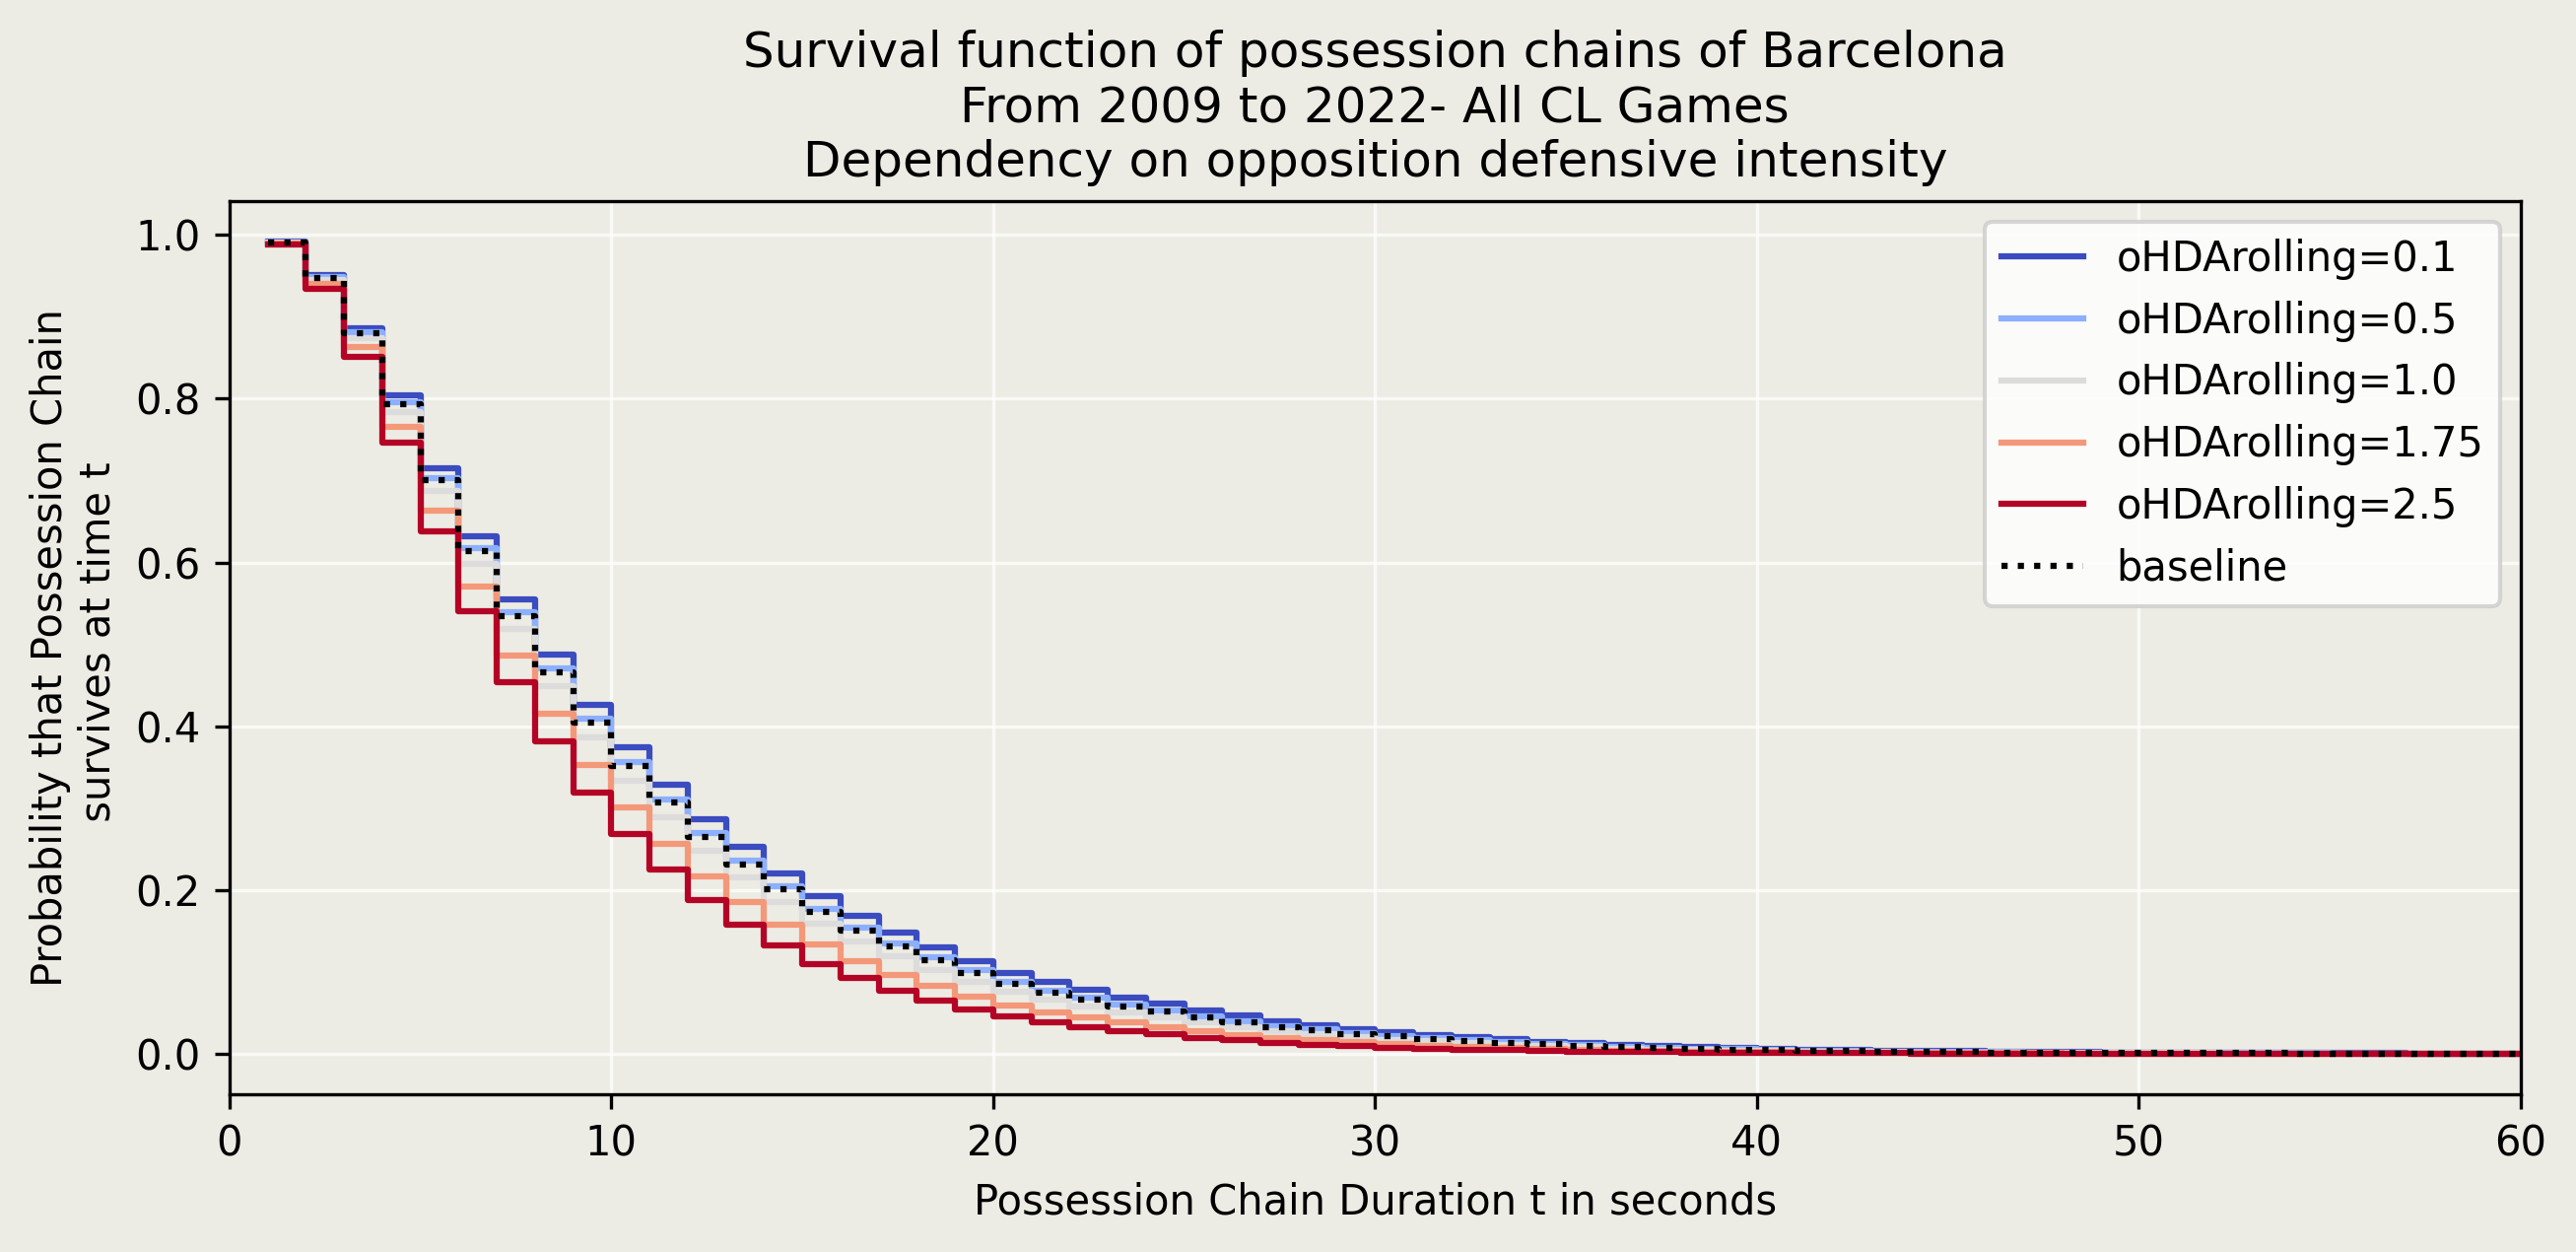
We have taken a look at possession chain survival curves, using Barcelona’s CL campaigns from 2008-09 onwards as a case study. We are going to use them further to check out certain factors that contribute to the ultimate demise of a possession chain. Now, you probably already have intuitive ideas as to what these factors are. Excessive verticality, usage of too many crosses, being down by a player or two, opposition high press intensity etc are all reasons why a team might or might not hold on to the ball well. To study the effect of such factors, we make use Cox Proportional Hazards model. Here are some partial dependency plots of survival curves.
The first effect is that of opposition pressure. Intuitively, we might think higher the pressure intensity, the harder it becomes to keep hold of the ball. Here I have created a metric called oHDArolling, which basically looks at 5-minute rolling averages of opposition pressure. As is shown in the following grpah, increase in oHDArolling brings the survival curve down - in other words, at any given time t, the probability of survival goes down.
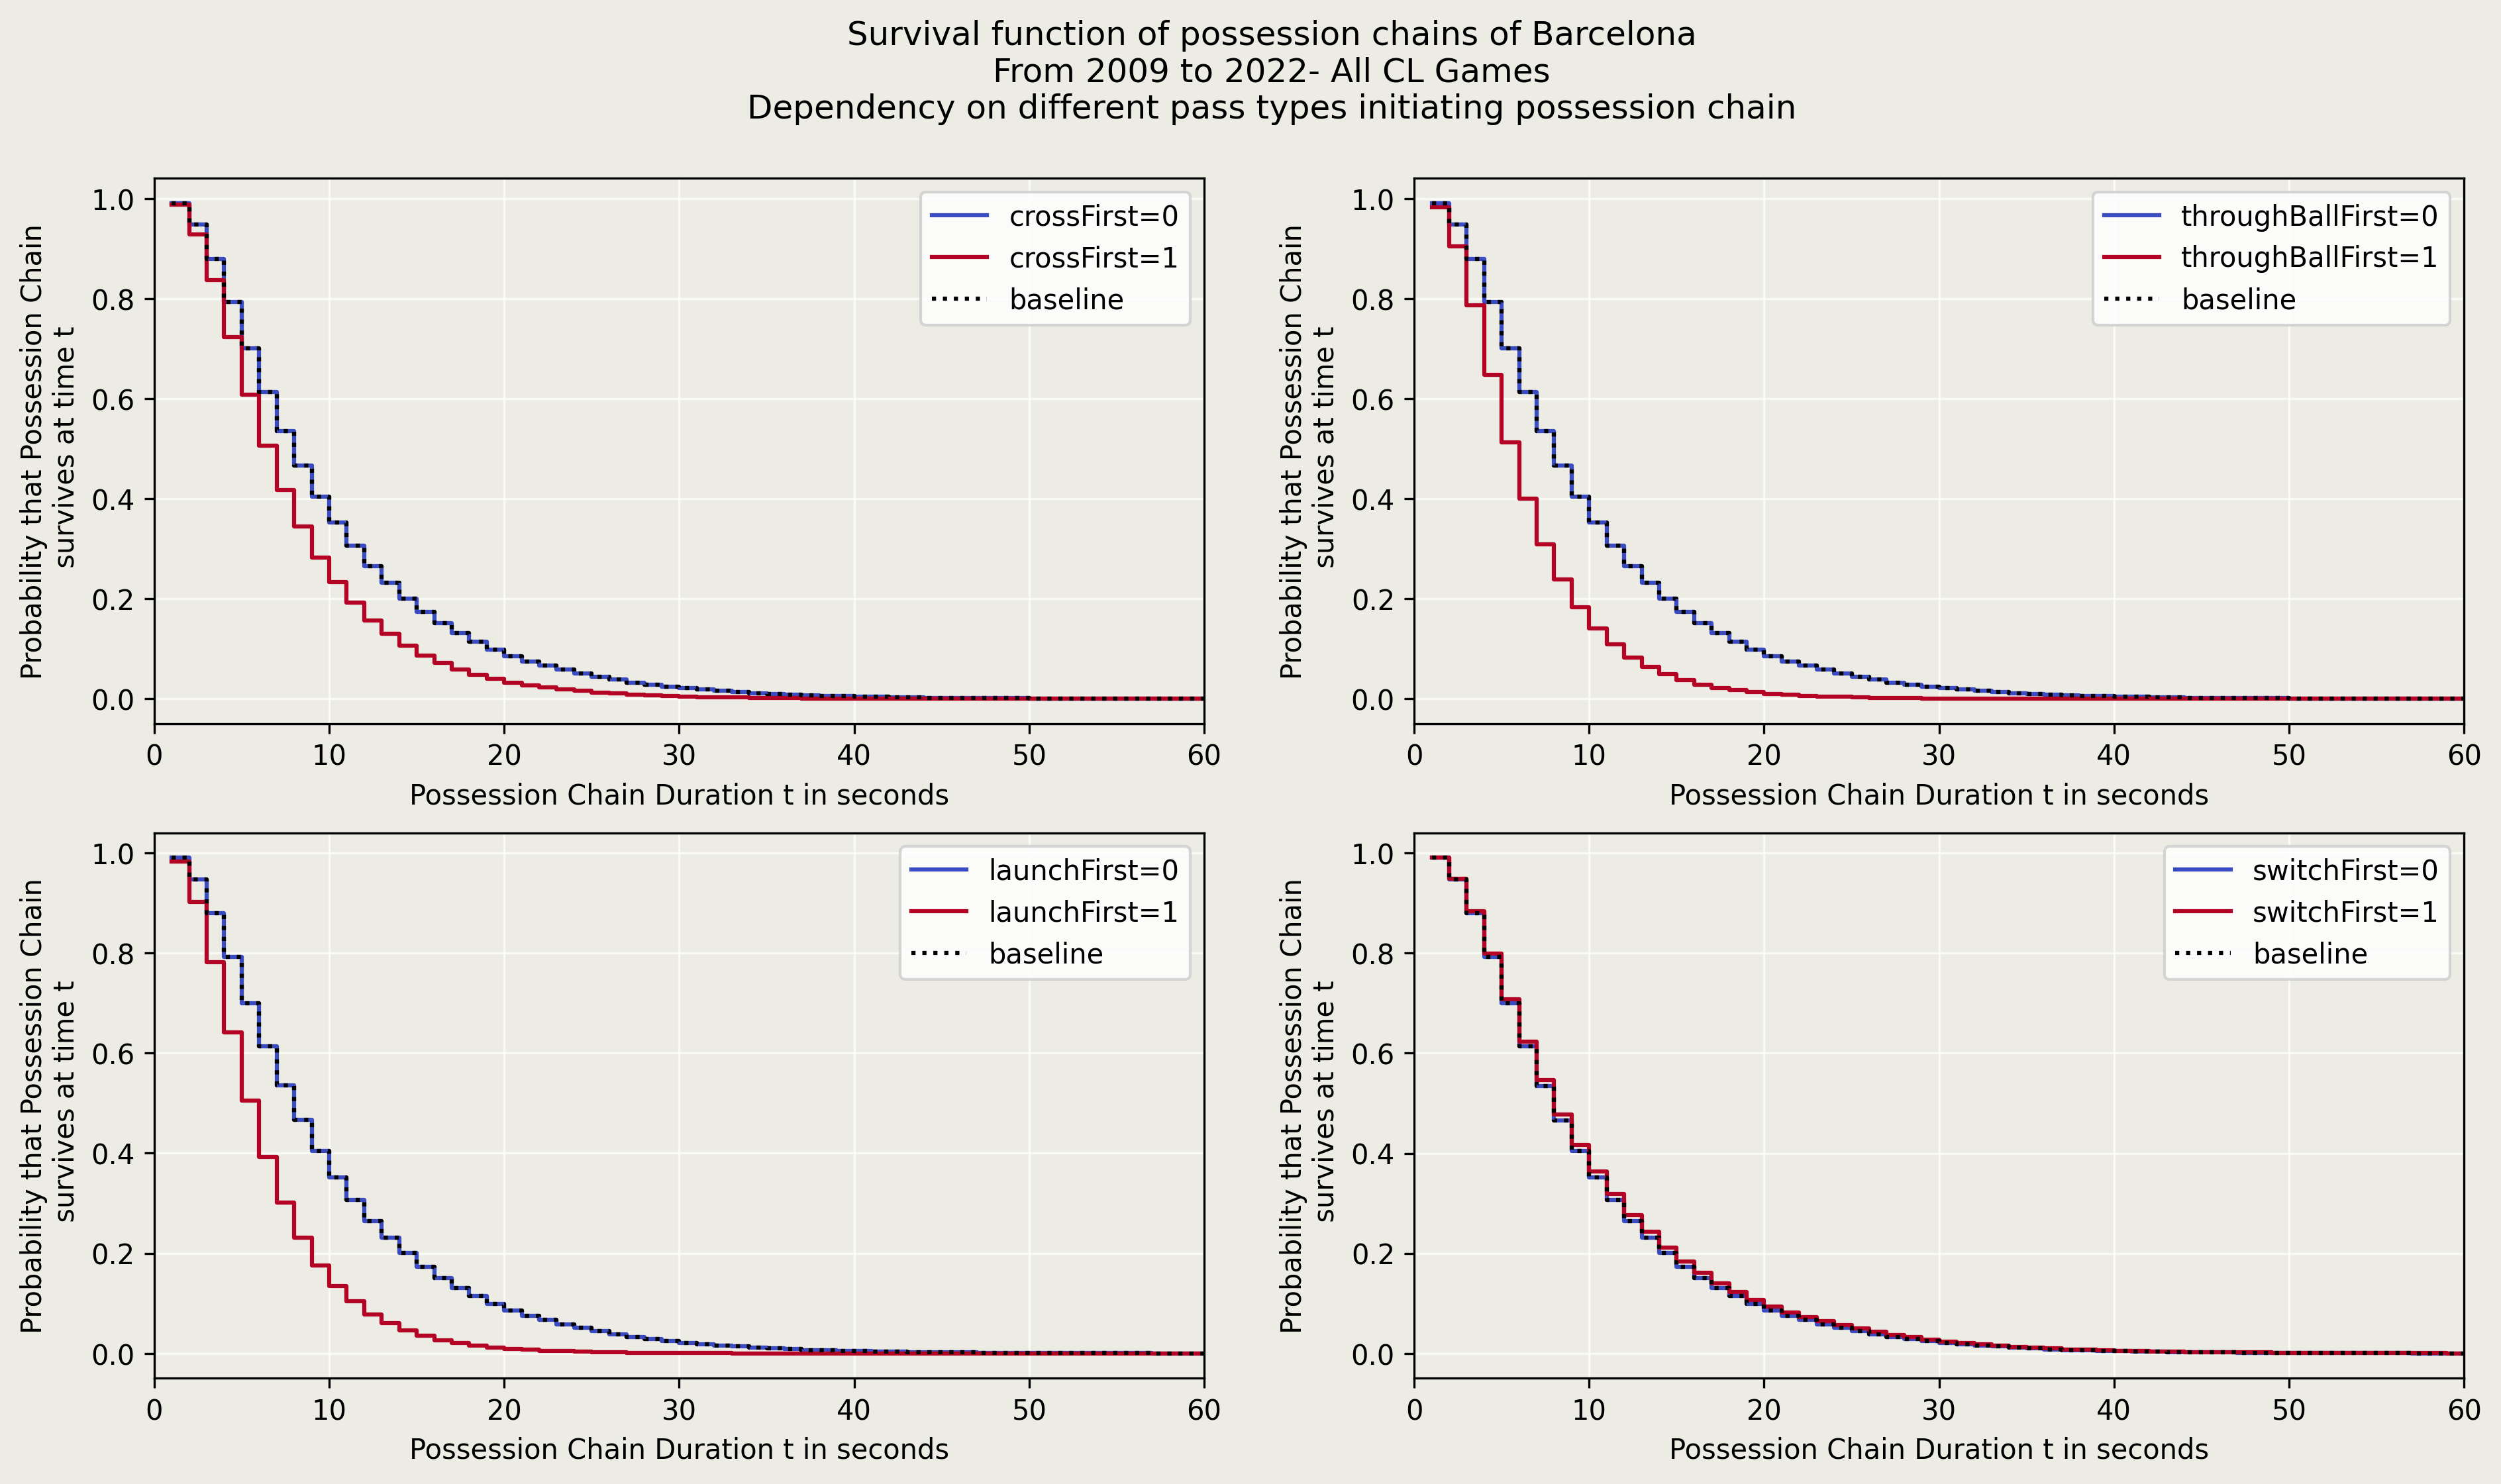
Next we look at various pass types that initiate a possession chain - launches, crosses, through balls, switches etc. As is shown and probably expected, crosses, through balls and launches are risky and lead to loss of possession more often. Switches seem to have no effect at least for Barcelona. Note that this doesn’t mean I am advocating against through balls or crosses. It’s always a balance of risk vs reward depending on the context of the game.
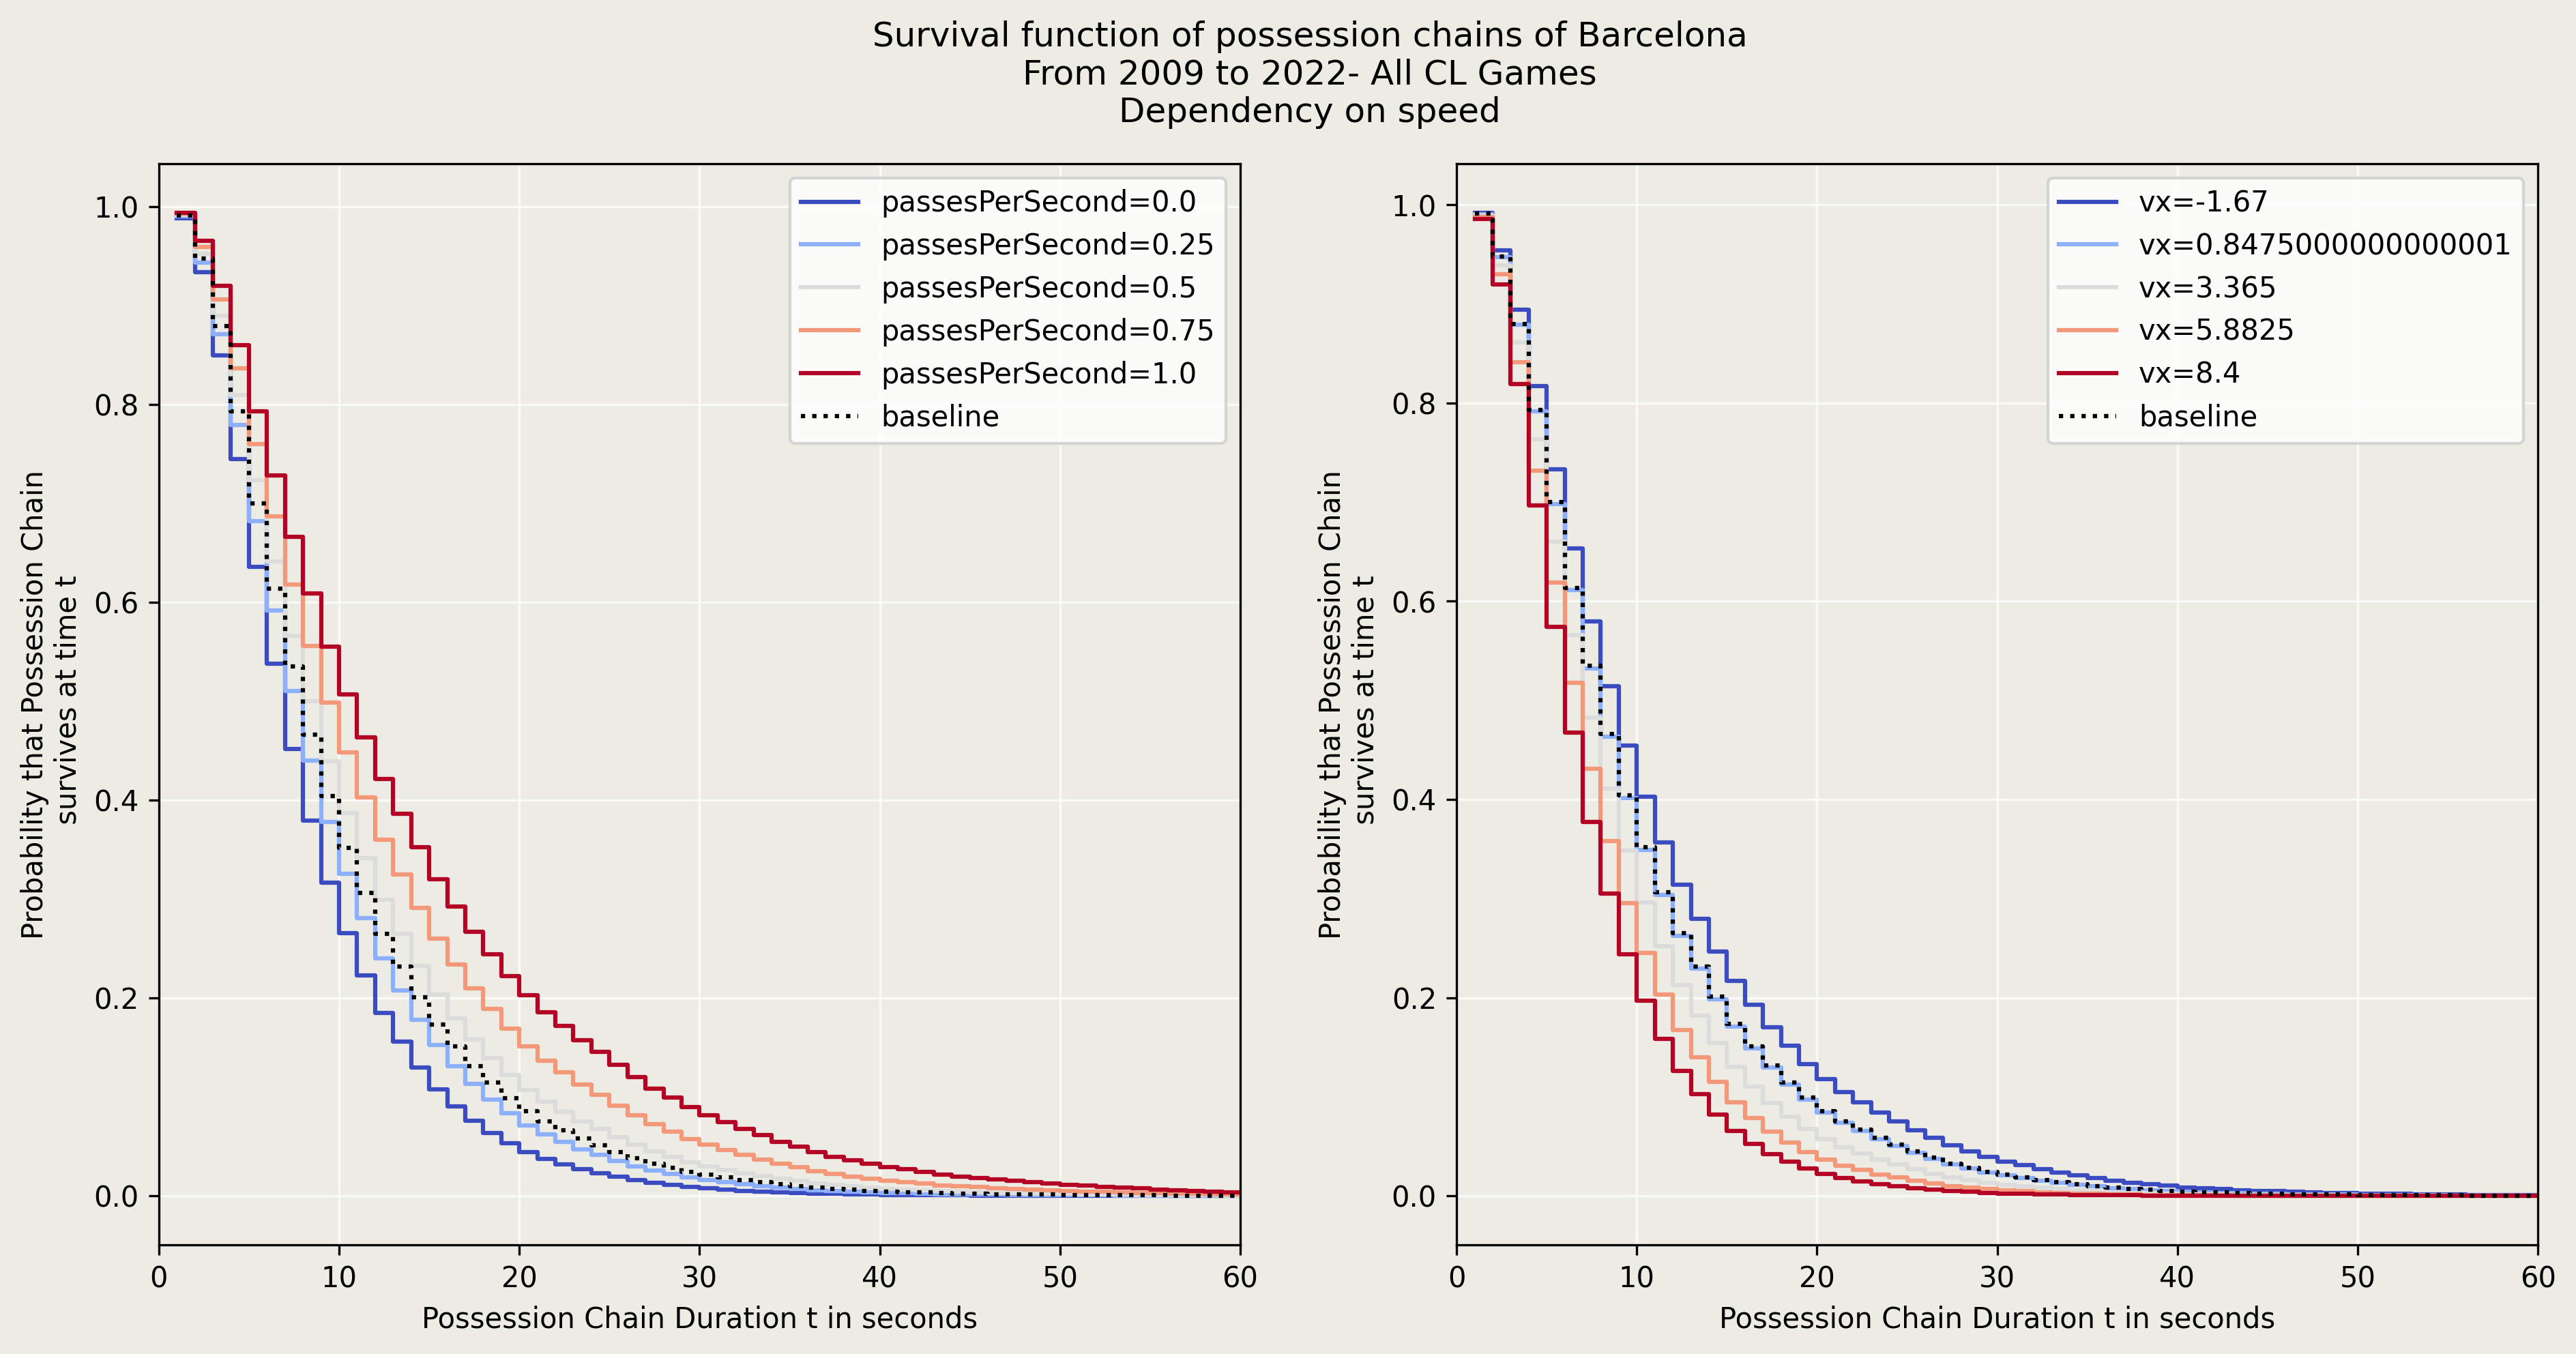
Next we take a look at speed of play. The graph on the left looks at average number of passes per second of possession chains. More passes seem to help retain possession better - think of quick one-twos zipping around the opposition and leaving them in the dust. The graph on the right looks at upfield speed vx. Negative vx implies going back, high positive vx means going upfield at great speed. The faster you go up the pitch, the riskier it becomes and hence more difficult to retain possession. In the words of Juan Manuel Lillo, “If you play the ball upfield at top speed all the time, hitting first time long balls, the ball will be back on top of you in seconds. Up and down, up and down . . . You have to pass when the moment’s right, to the right player.””
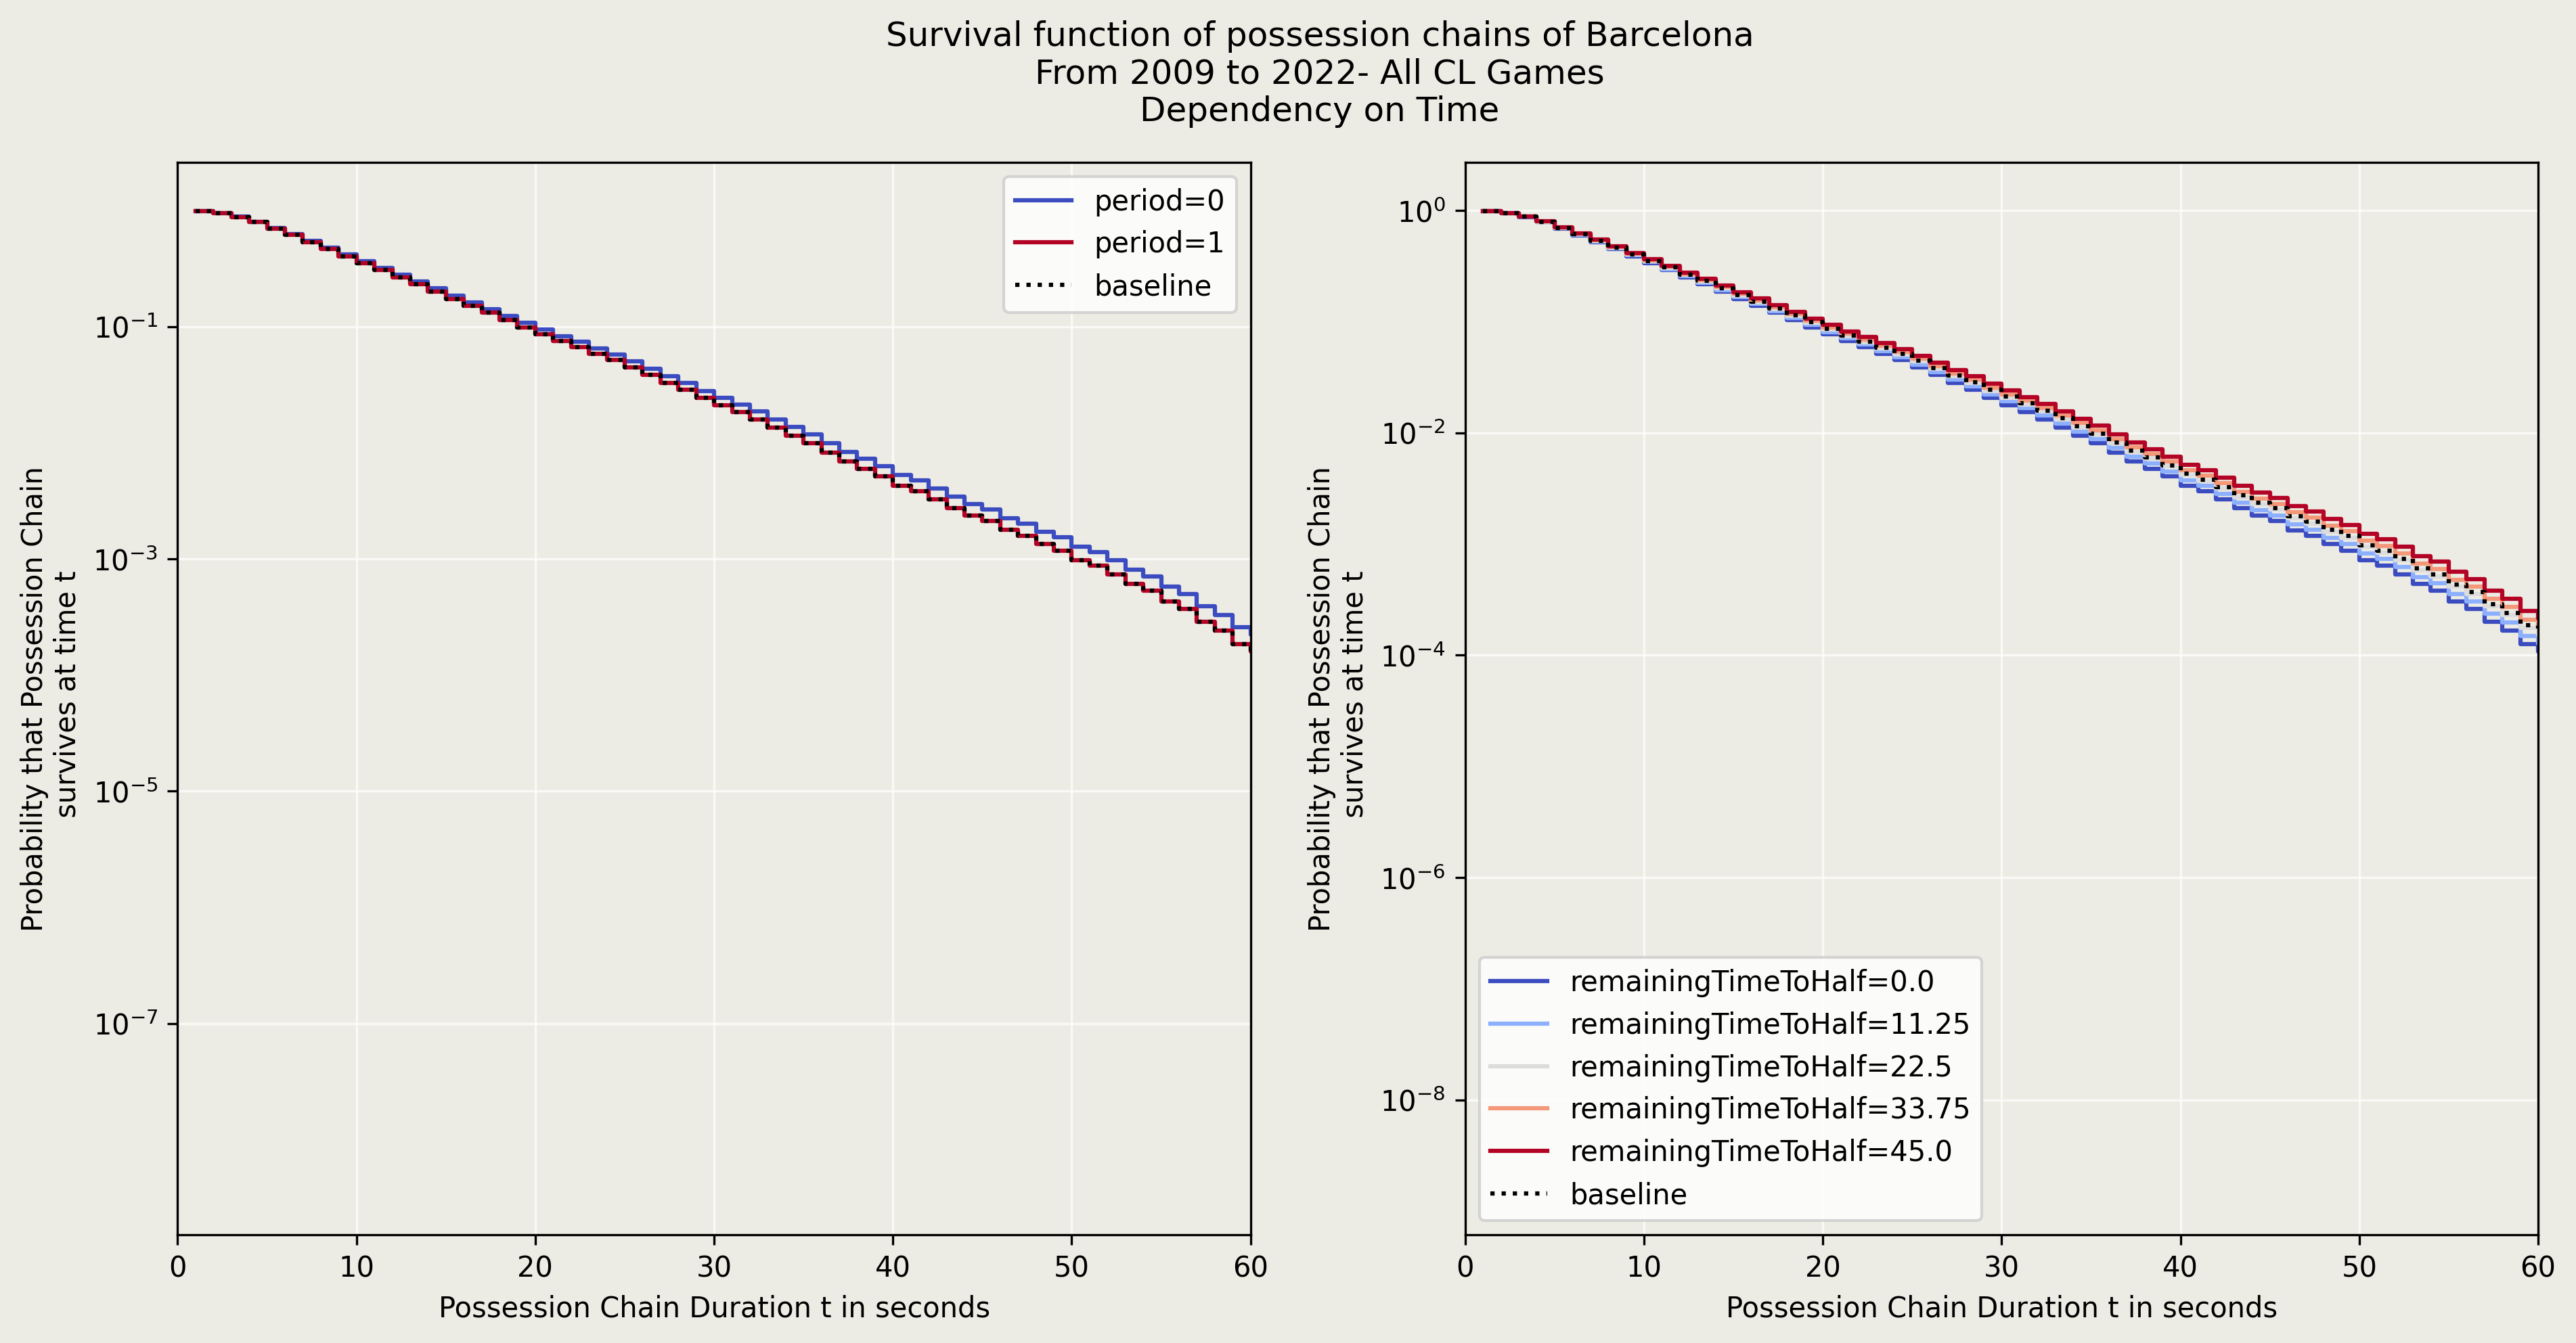
Next we look at temporal factors - first or second half, and minutes remaining for that half. I had to switch to a logarithmic scale for the y axis. The differences are tiny for Barcelona but might be significant for other teams. And the differences are exactly as I would have expected - games typically open up in the second half, especially if some team is losing. Also, halves usually start with tranquility but as they come closer to ending, it gets more frantic. Possessing the ball becomes harder.
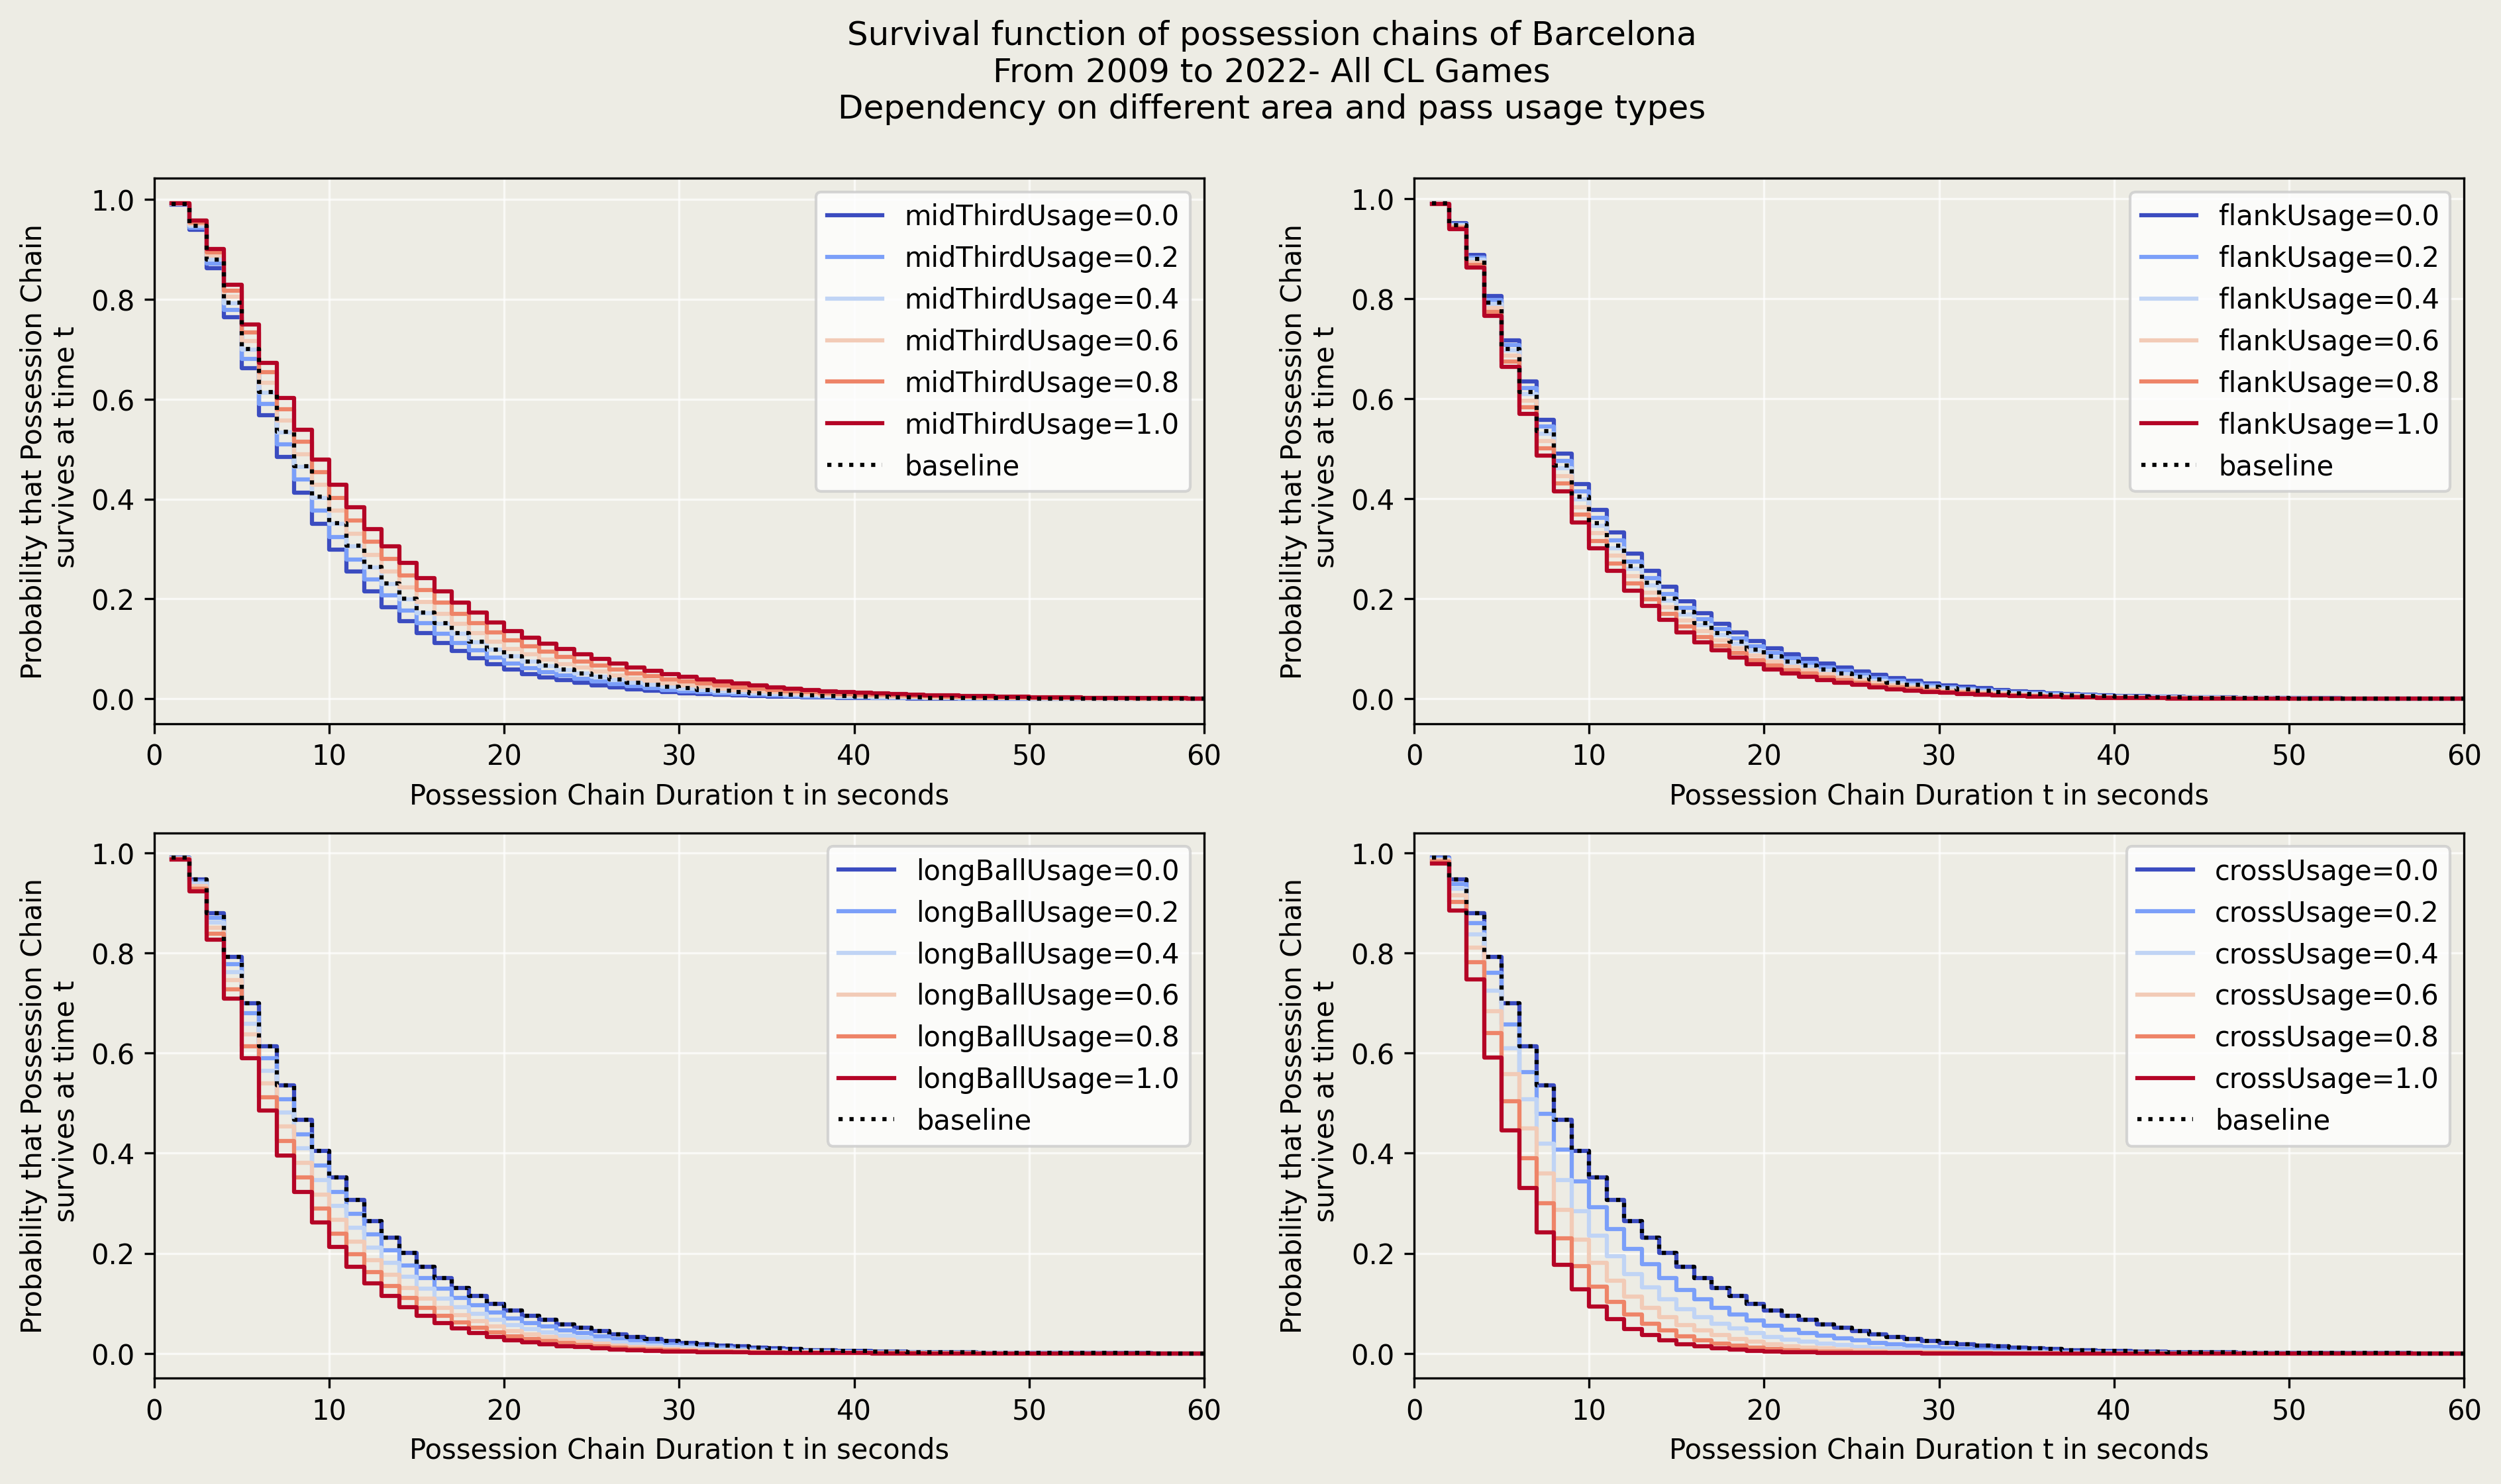
We also take a look at some usage rates and their effects. The top two graphs show the effects of usage of certain zones of the pitch. It seems like Barcelona does better at retaining possession when the ball is in the middle of the park. Makes sense given Barcelona’s most technically secure players bar Messi have always been midfielders, and even Messi spent a ton of time in the middle. The lower two graphs look at how frequently long balls usage and cross usage in possession chains lead to reduction of its survival probability.
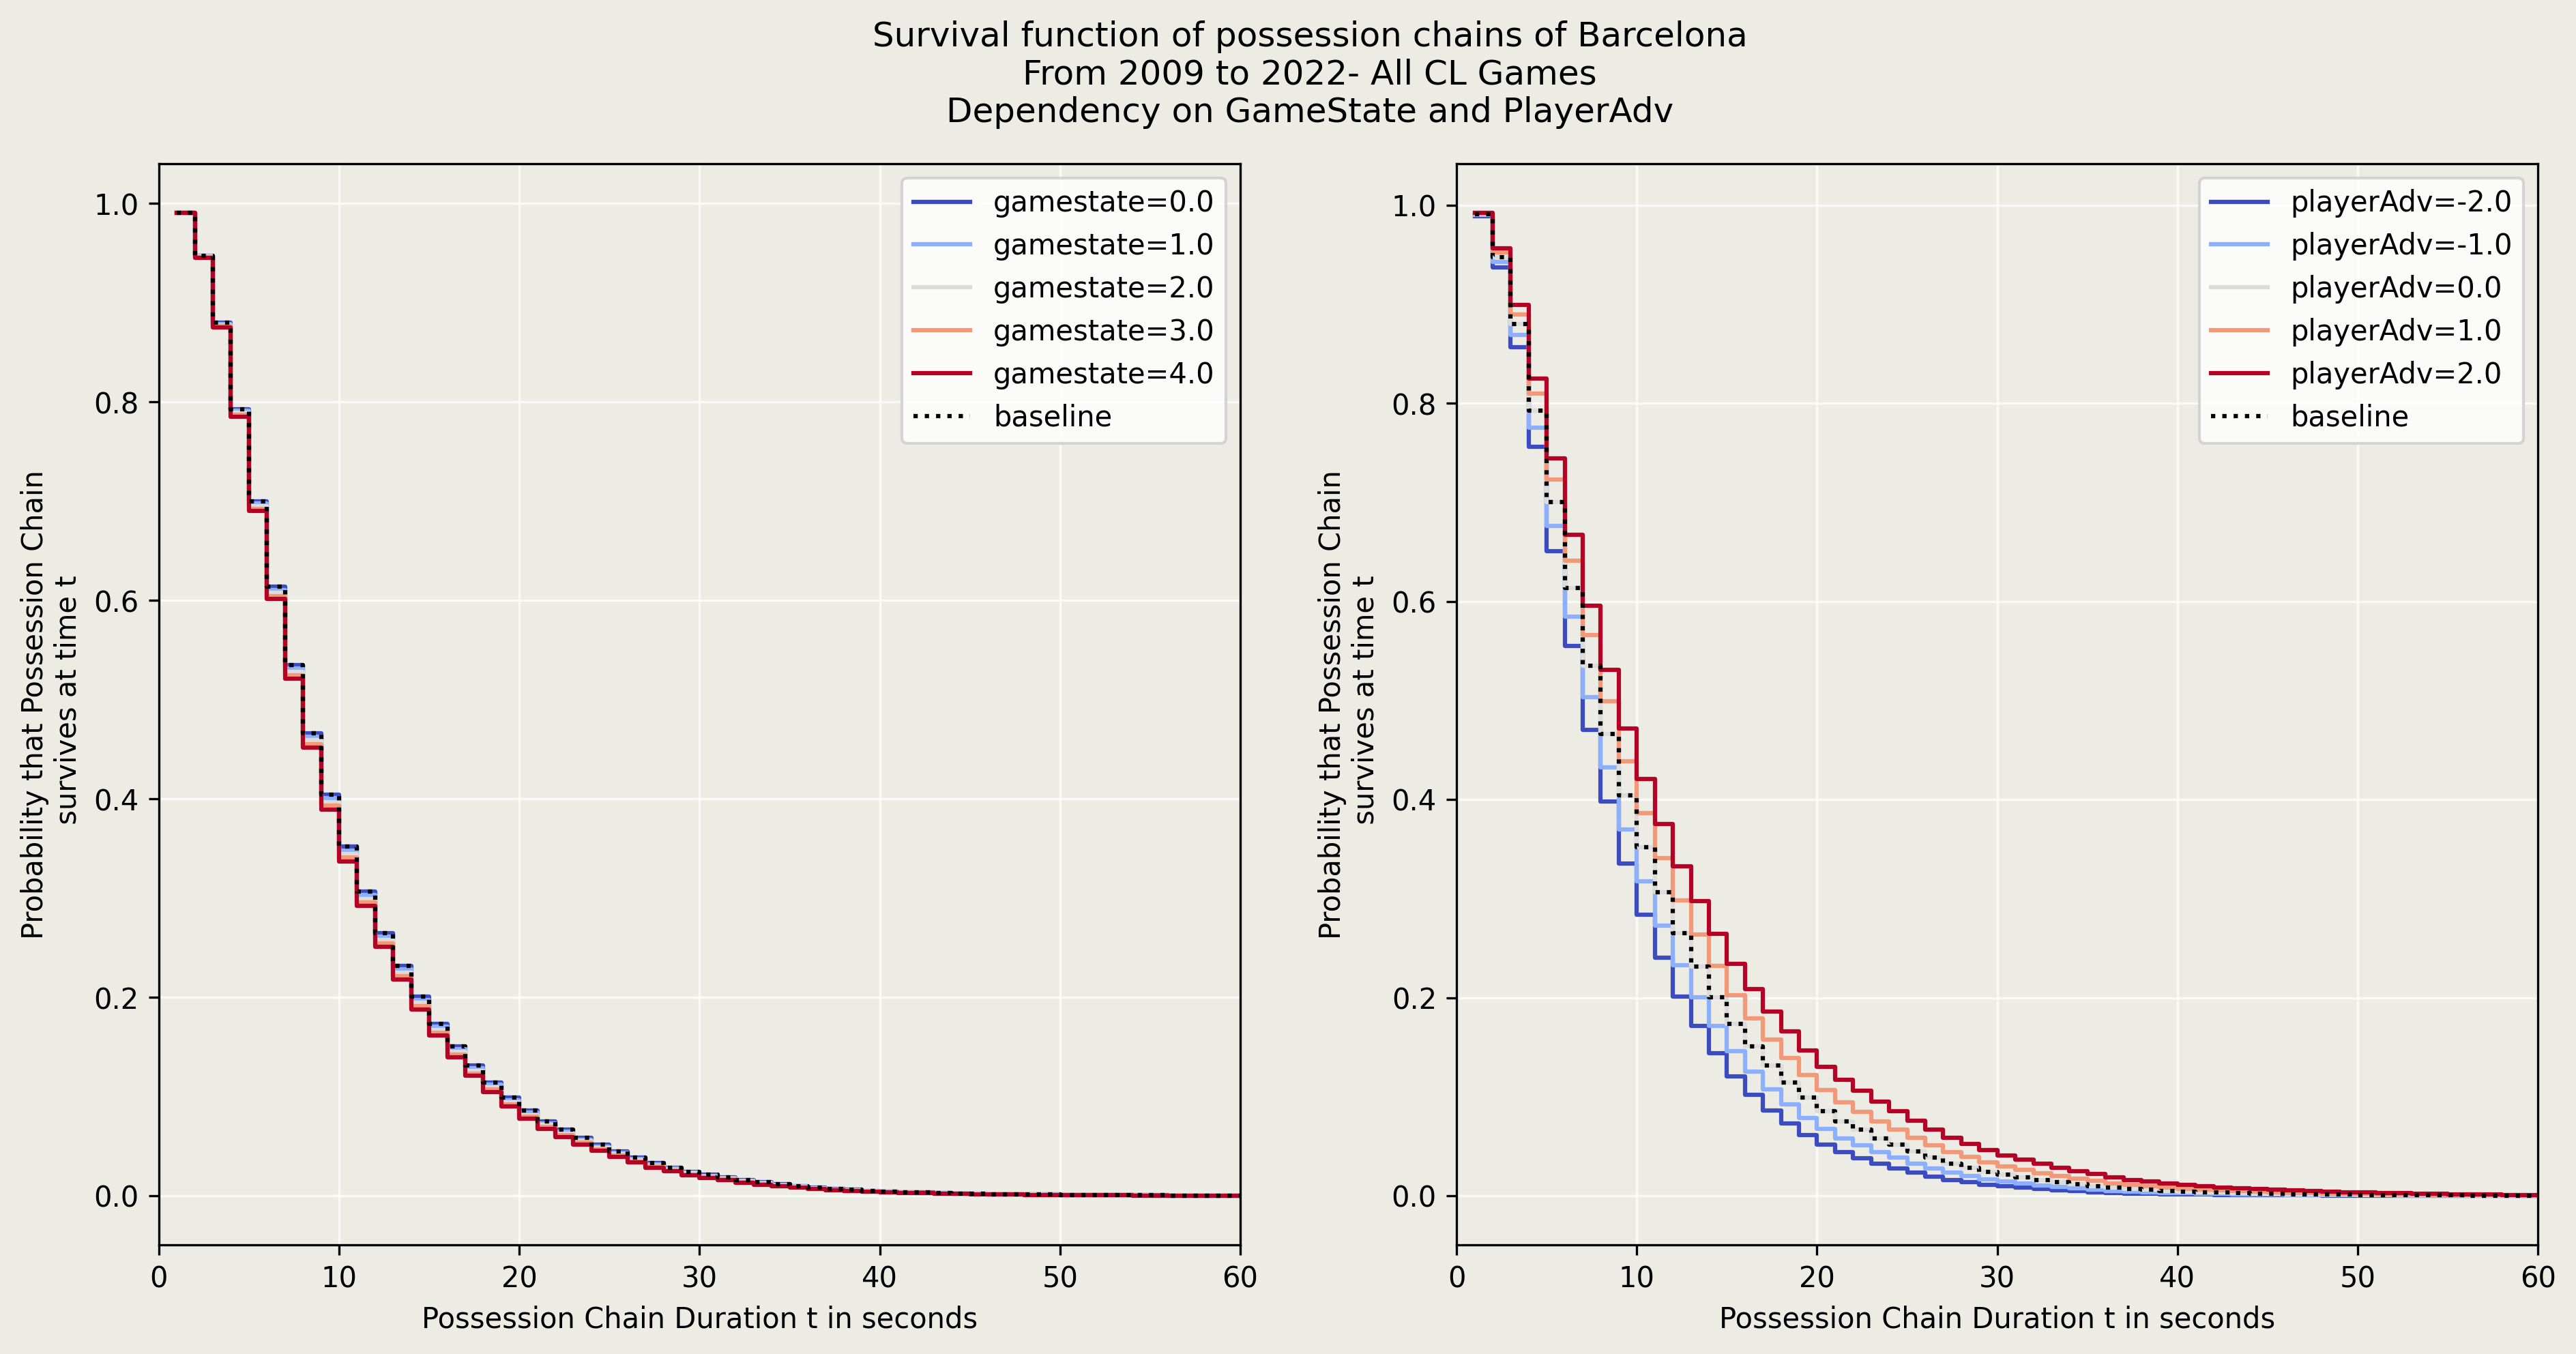
Finally, we take a look at game state and man advantage. It seems like game state has no pretty much no effect on Barcelona….they just play their usual style of “keep the ball, pass the ball”. Gamestate 0 corresponds to a tie, gamestates 1 and 2 correspond to winning by 1 or more than 1 goals respectively. Gamestates 3 and 4 correspond to losing by 1 or more than 1 goals respectively. There is a minor reduction in survival probability when losing - which is what my intuition said - but seems like the effect is minor for Barcelona. However, man advantage has a massive effect. A positive man advantage increases the survival probability while being a man down reduces it significantly. Very much an expected effect.
End
That’s it. This brings an end to the survival analysis case study. There are obviously tons of scope for further work here. Especially investigating the partial effects of interplay of multiple effects together - gamestate and time remaining, for eg. Or gamestate and longballs. Maybe for another day…